
We published an update on this Danger Zone pick on April 16, 2025. A copy of the associated report is here.
Tesla’s (TSLA: $290/share) second quarter earnings confirm our view that the stock is one of the most overvalued stocks in the market.
Tesla’s stock has been rising this year amid a sudden shift in overall market sentiment, with many investors now pricing in a soft-landing scenario after a brutal past year of Federal Reserve rate hikes. But the shift in market sentiment doesn’t change the fact that Tesla’s stock fundamentals are completely disconnected from reality. Tesla is a terribly overvalued stock that we think is worth closer to $26 per share instead of its current price of about $290 per share.
While Tesla is profitable, its profits are nowhere near the levels needed to justify its current valuation. We recognize that Tesla’s business generates an impressive return on invested capital (ROIC), which is a key measure of profitability, especially for an automaker. However, that ROIC is already declining in the trailing-twelve-month (TTM) period.
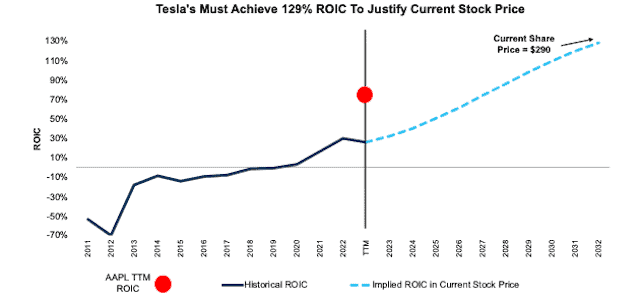
Using our reverse discounted cash flow (DCF) model, we find that for the stock to have any upside at current levels, Tesla must improve its ROIC to levels not achieved by even the most profitable businesses in the world[1]. Figure 1 shows Tesla’s historical ROIC along with the future ROIC implied by its current stock price. We provide the assumptions behind this DCF scenario later in this report.
Figure 1: Tesla’s Historical and Implied NOPAT: DCF Valuation Scenarios
Sources: New Constructs, LLC and company filings
Tesla’s latest earnings continue to show that it is not immune to competitive challenges and will likely see lower profitability in the future. But, its valuation implies the opposite. Any investor with fiduciary duties should be aware of the growing disconnect between Tesla’s current fundamentals and the future fundamentals implied by its stock price. Even in an optimistic future cash flow scenario, shares could trade as low as $26/share. All the details are below. See all our reports on Tesla here.
What Happened?
Supply Constrained Argument Is Gone: Bulls have long argued that demand for Tesla vehicles has always exceeded the supply of vehicles. However, Tesla’s multiple price cuts in 2023, along with its lackluster production levels through the first half of 2023, raise questions about just how much demand there is for Tesla vehicles, especially amid competition from rivals Ford (F), General Motors (GM) and virtually every other automaker. 2Q23 marks Tesla’s fifth consecutive quarter in which vehicles produced were greater than vehicles delivered. Tesla is no longer selling every vehicle it can make. Should demand for EVs slow, Tesla could find itself with higher than wanted inventory levels, which could lead to further price cuts and additional pressure on already falling margins.
Continued Cash Burn: Despite Tesla’s top line growth, it continues to burn massive amounts of cash. Over the past five years, Tesla has burned a cumulative $4.2 billion in free cash flow (FCF), including $3.6 billion over the trailing-twelve months (TTM) alone. Tesla has generated negative FCF in all but one year (2019) of its existence as a public company.
Margin Decline: Tesla’s “GAAP gross margin” was 18.2% in 2Q23, down from 19.3% in 1Q23 and 25.0% in 2Q22. 2Q23’s GAAP gross margin was below expectations of 18.7% and remains at its lowest level since 4Q20.
Tesla’s operating margin is also moving the wrong direction as it scales up. After selling 211 thousand more vehicles in 2Q23 compared to 2Q22, Tesla’s reported operating margin fell 493 basis points YoY in 2Q23. Tesla noted in its press release that reduced average selling prices were one of the items that impacted margins in the quarter. We would expect Tesla’s margins to fall further as competition limits pricing power across the industry.
Market Share Is Not Enough
While Tesla has rapidly ramped up vehicle production and deliveries, its market share must increase almost exponentially to justify the expectations baked into its stock price. However, as it stands, Tesla holds a meager share of the global auto industry, and its share of the EV market ranks behind incumbents across Europe and China.
In Europe, based on sales from May 2023, Tesla holds a 12% share of the EV market, much lower than VW Group (20%) and Stellantis (14%).
In China, also based on sales from May 2023, Tesla holds 9% of the EV market compared to a staggering 38% share for top competitor BYD.
Other Business Segments Aren’t Material
Bulls have long argued that Tesla isn’t just an automaker, but rather a technology company with multiple verticals such as insurance, solar power, housing, and, yes, robots. We’ve long refuted these bull dreams. Regardless of the promises of developing multiple business lines, Tesla’s business remains concentrated in its auto segment. Auto revenue accounted for 86% of Tesla’s TTM revenue as of 2Q23.
What Does It Mean?
Tesla can no longer enjoy its first mover advantage as many other major automakers are producing electric vehicles. These competitors have more experience in auto production and more resources and cash flow than Tesla to invest in the electric vehicle market.
Tesla is at risk of losing market share to its competitors in the electric vehicle space and its stock price is currently not reflecting that, which is a major risk for investors.
Reverse DCF Math: Quantifying Expectations In TSLA
Below, we use our reverse DCF model to provide clear, mathematical evidence that Tesla’s valuation is too high given the expectations baked into its current stock price. We will also show the downside risk should Tesla grow at more reasonable levels. Specifically, we analyze:
- Implied ROIC
- Implied NOPAT
- Implied vehicles sold and attendant market share
- Implied vehicles sold and attendant market share assuming Tesla’s “non-auto businesses” account for 40% of total revenue
Tesla’s Valuation Implies 129% ROIC
We start with quantifying the expectations in Tesla’s current price, and what they imply about Tesla’s ROIC. In order to justify its current price of $290/share, our model shows Tesla would need to:
- immediately achieve a 13% NOPAT margin (2x Toyota’s TTM margin, compared to Tesla’s TTM margin of 12%)
- grow revenue by 36% compounded annually and
- grow invested capital at just a 15% CAGR (vs. 50% CAGR from 2012–TTM) to expand capacity over the next decade.
In this scenario, Tesla would generate $1.7 trillion in revenue in 2032, which is 1.7x the combined revenues of Toyota, Stellantis (STLA), Ford (F), General Motors (GM), Honda Motor Co. (HMC), and Nissan (NSANY) over the TTM.
This scenario also implies that Tesla improves its ROIC to 129% in 2032, up from 25% over the TTM. For reference, no other major automaker earns an ROIC greater than 20%, and only two companies in the S&P, Moderna (MRNA) and Fortinet (FTNT), earn an ROIC above 129% over the TTM.
If we instead assume Tesla’s:
- NOPAT margin remains 11.5% (equal to TTM) from 2023 through 2032,
- revenue grows at consensus rates in 2023 (27%), 2024 (26%), and 2025 (23%),
- revenue grows 23% a year (continuation of 2025 estimate) from 2026–2033, and
- invested capital grows at just an 8% CAGR from 2023-2032, then
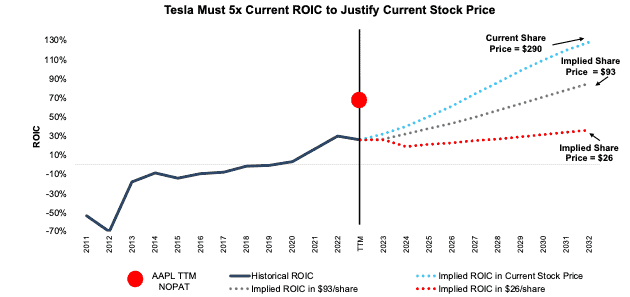
the stock would be worth just $93/share today – a 68% downside to the current price. In this scenario, Tesla improves ROIC to 85% in 2032, still above Apple’s (AAPL) TTM ROIC.
Lastly, in our third DCF scenario, if we estimate more reasonable (but still very optimistic) growth for Tesla, the stock is worth just $26/share. Here’s the math, assuming Tesla’s:
- NOPAT margin is 11.5% in 2023 and falls to 7% (equal to Toyota’s TTM margin) in 2024–2032,
- revenue grows at consensus rates in 2023 (27%), 2024 (26%),
- revenue grows 15% a year from 2025 – 2032, and
- invested capital grows at a 6% CAGR from 2023-2032, then
the stock would be worth just $26/share today – a 91% downside to the current price. In this scenario, Tesla still improves its ROIC to 36% by 2032.
Figure 2 compares Tesla’s historical ROIC to the ROIC implied in the above scenarios to illustrate just how high the expectations baked into Tesla’s stock price remain.
Figure 2: Tesla’s Historical and Implied ROIC: DCF Valuation Scenarios
Sources: New Constructs, LLC and company filings
Tesla Priced to Generate More Profits Than Apple
Next, we quantify the NOPAT expectations in each of the DCF scenarios outlined above.
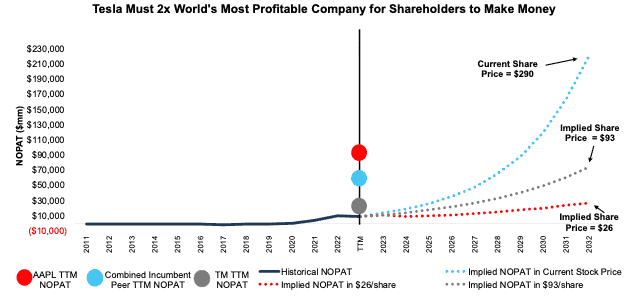
In scenario 1 (expectations in the current price), Tesla would achieve a NOPAT margin equal to its company record (already fallen to 11.5% over the TTM) and would generate $220 billion in NOPAT in 2032. At $220 billion, Tesla’s NOPAT would be 3.5x all incumbent peers’[2] TTM NOPAT and 2.2x Apple’s (AAPL) TTM NOPAT, which, at $98.1 billion, is the highest of all companies we cover.
In scenario 2 (expectations in $93/share), Tesla grows NOPAT to $74.4 billion, or nearly 8x its TTM NOPAT and 1.2x the combined TTM NOPAT of peers.
In scenario 3 (expectations in $26/share), Tesla still grows NOPAT to $27.3 billion, or 3x its TTM NOPAT and greater than each of its individual incumbent peers.
Figure 3 compares the firm’s historical NOPAT to the NOPAT implied in the above scenarios to illustrate just how high the expectations baked into Tesla’s stock price remain. For additional context, we show Apple’s, Toyota’s, and the combined incumbent peers’ TTM NOPAT.
Figure 3: Tesla’s Historical and Implied NOPAT: DCF Valuation Scenarios
Sources: New Constructs, LLC and company filings
Tesla Priced to Own 59%+ of the Global Passenger EV Market
Tesla selling 1.6 million cars over the TTM is no small feat. However, that number is minuscule compared to the number of vehicles Tesla must sell to justify its stock price.
Below, we quantify the vehicle sales, along with the implied market share of those sales, implied by the revenue Tesla generates in each of the DCF scenarios above. We start by analyzing the implied sales baked into its current stock price.
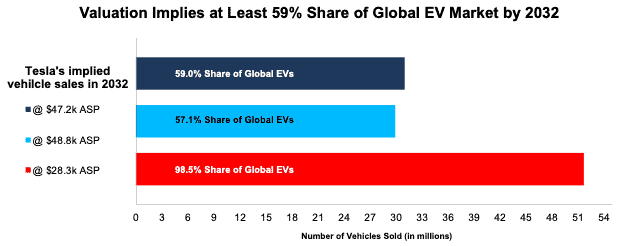
In scenario 1 above, Tesla generates $1.7 trillion in revenue in 2032. If we assume automotive revenue remains at 86% of total revenue as in the TTM, then Tesla generates $1.5 trillion in automotive revenue. This revenue figure implies Tesla will sell the following number of vehicles based on ASP levels:
- 31.0 million vehicles – current ASP of $47.2k
- 29.9 million vehicles – ASP of $48.8k (average new car price in U.S. in June 2023)
- 51.6 million vehicles – ASP of $28.3k (average new car price across the world in 2022)
For reference, Toyota (TM), the world’s largest automaker, sold 10.5 million vehicles in 2022 and is projected to sell 10.4 million in 2023. Next, we can analyze implied market share of such sales volume based on the “stated policies” scenario from the International Energy Agency (IEA) for the potential size of the market in 2032[3].
In this scenario, the vehicle sales noted above would represent the following implied market share in 2032:
- 59.0% for 31.0 million vehicles
- 57.1% for 29.9 million vehicles
- 98.5% for 51.6 million vehicles
Figure 4: Tesla’s Implied Vehicle Sales in 2032 to Justify $290/Share
Sources: New Constructs, LLC and company filings
The likelihood of reaching any of the above-mentioned market share scenarios is extremely unlikely in such a competitive industry. As noted above, Tesla currently holds ~12% and 9% market share in Europe and China, respectively. Even Tesla’s estimated 59% EV share (and falling) in the U.S. would not be enough to justify its stock price at the low end of ASPs in the scenario illustrated above.
In DCF scenario 2 above, Tesla’s implied automotive revenue of $558.0 billion implies it will sell 11.8 million vehicles in 2032 at an ASP of $47.2k. 11.8 million vehicles also implies a 23% share of the global passenger EV market in 2032. For reference, Volkswagen, the world’s second largest automaker, sold 8.3 million vehicles in 2022.
In DCF scenario 3 above, Tesla’s implied automotive revenue of $336.6 billion implies it will sell 7.1 million cars (14% of the global passenger EV market in 2032) in 2032 at an ASP of $47.2k.
Reverse DCF Math: Assume Tesla’s “Other Businesses” Are Wildly Successful
Bulls will often argue that Tesla is not “just a car company” which is the reason for its lofty valuation. In multiple prior reports, we’ve shown why such an argument doesn’t hold water. However, for illustrative purposes, let’s assume bulls are right.
Using the same assumptions as the DCF scenario above, but optimistically assuming Tesla’s automotive revenue falls to 60% of total revenue by 2032, we review the implied vehicle sales assuming autos are only 60% of Tesla’s business in the future[4].
In the DCF scenario 1 above, Tesla generates $1.7 trillion in revenue in 2032. If autos are only 60% of total revenue, then, we have $1.1 trillion in automotive revenue. This revenue figure implies Tesla will sell the following number of vehicles based on these ASP levels:
- 21.5 million vehicles – current ASP of $47.2k
- 20.8 million vehicles – ASP of $48.8k (average new car price in U.S. in June 2023)
- 35.9 million vehicles – ASP of $28.3k (average new car price across the world in 2022)
The vehicle sales noted above would represent the following implied market share in 2032:
- 41.1% for 21.5 million vehicles
- 39.7% for 20.8 million vehicles
- 68.5% for 35.9 million vehicles
In other words, even if we assume that Tesla’s automotive revenue makes up just 60% of its total revenue in 2032, it still must take at least 40% of the expected 2032 global EV market share to justify its current stock price.
We can also calculate the implied vehicle sales in the two additional DCF scenarios assuming Tesla’s automotive revenue equal 60% of total revenue in 2032.
In DCF scenario 2 above, Tesla’s implied automotive revenue of $388.0 billion implies it will sell 8.2 million vehicles in 2032 at an ASP of $47.2k, which equals 16% of the global passenger EV market in 2032.
In DCF scenario 3 above, Tesla’s implied automotive revenue of $243.0 billion implies it will sell 5.0 million cars (10% of the global passenger EV market in 2032) in 2032 at an ASP of $47.2k.
Reverse DCF Math: Above Scenarios May be Too Optimistic
Each of the above DCF scenarios assumes Tesla’s invested capital grows between 6-15% compounded annually through 2032 as it increases production capacity to meet the implied vehicle sales in each scenario. This assumption is highly conservative, as Tesla’s invested capital has grown much faster in the past. For reference, Tesla’s invested capital grew 50% compounded annually from 2012 – TTM.
In other words, we aim to provide inarguably best-case scenarios for assessing the expectations for future market share and profits reflected in Tesla’s stock market valuation. Even doing so, we find that Tesla is significantly overvalued.
This article was originally published on July 19, 2023.
Disclosure: David Trainer, Kyle Guske II, Hakan Salt, and Italo Mendonça receive no compensation to write about any specific stock, sector, style, or theme.
Questions on this report or others? Join our Society of Intelligent Investors and connect with us directly.
Appendix
Figure I shows the top 5 companies in the S&P 500 ranked by 3-yr average ROIC. As can be seen, only two companies earn a higher ROIC than the ROIC implied in Tesla’s current stock price.
Figure I: Highest 3-Year Average ROIC in S&P 500: TTM as of July 19, 2023
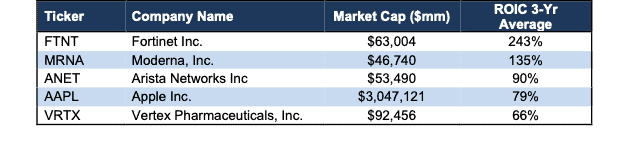
Sources: New Constructs, LLC and company filings
[1] See appendix for list of companies with a 3-yr average ROIC higher than the implied ROIC in Tesla’s current stock price.
[2] Combined incumbent peers’ NOPAT includes Stellantis, Toyota, General Motors, Honda Motor, Ford, and Nissan.
[3] Units sold in 2032 assumes that the EV market grows YoY from 2030-2032 at the same compound annual growth rate the IEA projects sales will grow from 2025-2030.
[4] For argument’s sake, we optimistically assume that Tesla achieves the same NOPAT margin and ROIC on the 40% of revenue from its “other businesses’ that it would achieve on its automotive revenue. Given the lack of success in its other businesses to date, this seems an optimistic assumption, but allows us to create best case scenarios, nonetheless.
2 replies to "Tesla’s 2Q23 Earnings Confirm Our Thesis that TSLA Is One of the Most Overvalued Stocks"
Thank you! Well written.
Spot on! Great analysis.