
A recent look at the ETFs with more than $1 billion if inflows this year revealed that many investors are still chasing momentum instead of looking for value. For example, the iShares MSCI USA Momentum Factor ETF (MTUM) has taken in over $2.3 billion (which ranks eighth out of the 21 equity ETFs with $1 billion or more of net inflows in 2018). Investors are betting that momentum strategies will keep working for the foreseeable future.
By contrast, this value ETF has taken in just one-tenth of MTUM’s inflows, as investors think value investing doesn’t work anymore. However, as we’ve written before, value investing still works, it’s just become much harder. Many value funds underperform because they attempt to execute value investing strategies that rely on overly simplistic metrics, like price to earnings or price to book, that don’t measure value well.
Leveraging our Robo-Analyst technology[1], which analyzes the holdings of all 7,908 ETFs and mutual funds under coverage, we found this ETF with high quality holdings[2] that should appeal to sophisticated value investors. iShares Edge MSCI USA Value Factor ETF (VLUE) is this week’s Long Idea.
Ignore Momentum and Find Value
VLUE has taken in just $243 million in 2018, despite offering better risk/reward from a value investor’s perspective. MTUM has outperformed so far – up 6.4% in 2018 vs. VLUE at 0% for the year – but we don’t expect that outperformance to continue. Chasing momentum can have a devastating impact on one’s portfolio when the momentum stops.
While the returns of MTUM may look appealing, investors looking for exposure to Large Cap stocks can find better holdings, and risk/reward, in VLUE.
Figure 1: VLUE Asset Allocation Compared to MTUM
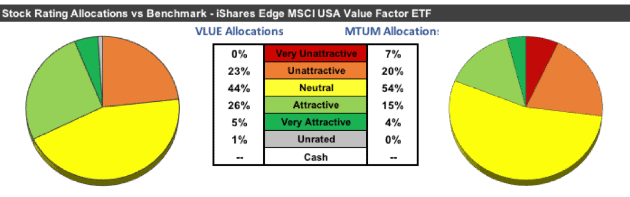
Sources: New Constructs, LLC and company filings
Per Figure 1, VLUE allocates 31% of its assets to Attractive-or-better rated stocks compared to just 19% for MTUM. On the flip side, VLUE allocates 23% of its assets to Unattractive-or-worse rated stocks compared to 27% for MTUM. Given the higher allocation to Attractive-or-better rated stocks, and lower allocation to Unattractive-or-worse rated stocks, VLUE appears better positioned to capture upside potential while taking on less downside risk.
Beyond overall risk/reward rating, VLUE allocates to stocks that are more undervalued relative to MTUM. The price-to-economic book value (PEBV) ratio of stocks held by VLUE is just 1.4 vs. 3.9 for MTUM holdings. This ratio means the market expects the stocks held by MTUM to grow after-tax profit (NOPAT) more than two times that of VLUE’s holdings. Similarly, the market-implied growth appreciation period of VLUE’s holdings is 16 years vs. 43 years for MTUM. In other words, MTUM constituents have to grow economic earnings for 27 years longer than companies held by VLUE to justify their current stock prices.
In a market propped up by illusory earnings beats, holding such overvalued stocks adds unnecessary risk to investors’ portfolios.
VLUE Finds Value Relative to its Benchmark as Well
VLUE also holds higher quality stocks when compared to its benchmark, the iShares Russell 1000 Value ETF (IWD), and the general market (S&P 500).
Figure 2 contains our detailed fund rating for VLUE, which includes each of the criteria we use to rate all ETFs under coverage. These criteria are very similar to our Stock Rating Methodology, because the performance of an ETF’s holdings equals the performance of an ETF. The results of this analysis reveal important information for investors in VLUE.
Figure 2: iShares Edge MSCI USA Value Factor ETF Rating Breakdown
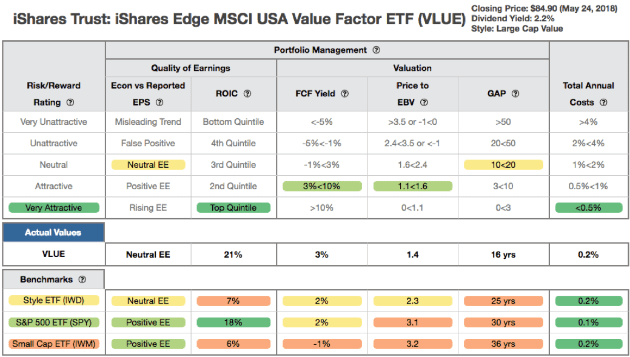
Sources: New Constructs, LLC and company filings
As Figure 2 shows, VLUE’s holdings are superior to IWD and SPY in four out of the five criteria that make up our holdings analysis:
- The return on invested capital (ROIC) for VLUE’s holdings is 21%, just above the 18% ROIC earned by companies held by SPY and three times the 7% earned by IWD holdings.
- The 3% free cash flow (FCF) yield of VLUE’s holdings is greater than the 2% earned by SPY and IWD stocks.
- The PEBV ratio for VLUE is 1.4, while the PEBV ratio for IWD is 2.3 and for SPY is 3.1.
- Our discounted cash flow analysis reveals an average market-implied growth appreciation period of 16 years for VLUE holdings compared to 25 years for IWD and 30 years for SPY.
Ultimately, the stocks held by VLUE generate superior cash flows compared to IWD and SPY, yet the market projects IWD and SPY stocks will grow profits at a faster rate and for a longer period of time.
VLUE Is the Value in Large Cap Value
VLUE is the best when compared to large cap value ETFs, such as the Vanguard Value Index Fund (VTV), Vanguard Dividend Appreciation Fund (VIG), Vanguard High Dividend Yield Index Fund (VYM), iShares Select Dividend ETF (DVY) and State Street SPDR S&P Dividend ETF (SDY). Per Figure 3, VLUE has the highest ROIC (best quality of earnings) and lowest PEBV ratio (cheapest valuation) in this group.
Despite its holdings being more profitable and cheaper, VLUE has just $3.3 billion in assets. This asset level is dwarfed by the group in Figure 3, which has anywhere from $16 billion to $36 billion in assets. Investors searching for true value should take a closer look at VLUE.
Figure 3: VLUE Rating Breakdown Vs. Largest Large Cap Value ETFs
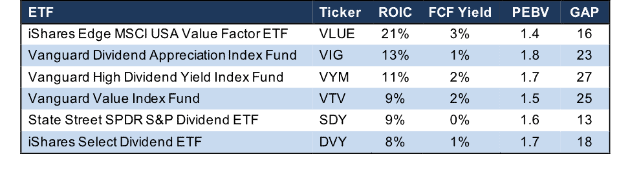
Sources: New Constructs, LLC and company filings.
Recent Long Idea, General Motors (GM), is one of VLUE’s top holdings and makes up 3.1% of its portfolio. As we noted in our original report, the expectations baked into GM’s stock imply the firm’s profits will permanently fall by 50%. Such an expectation seems beyond pessimistic given that GM is best positioned to excel in the future of self-driving and electric vehicles. Given the gloom and doom baked into the stock, GM presents attractive risk/reward.
If pre-tax margins fall to 2010 levels (5.7%) and NOPAT declines by 2% compounded annually for the next five years, the stock is worth $75/share today (more than double the current price). See the math behind this dynamic DCF scenario here. Essentially, investors have a chance to double their money even if profits decline over the next five years.
Finding stocks with strong fundamentals and undervalued stock prices is a staple of value investing. GM, as well as VLUE’s other holdings, clearly represent Value in Large Cap Value ETFs.
VLUE Looks Positioned to Continue Outperforming
Beyond holdings analysis, one must also analyze the costs of investing in a particular fund, as high costs can destroy any potential return. As a passively managed ETF, one would expect VLUE’s total annual costs to be much lower than an actively managed counterpart, and they are. With total annual costs (TAC) of 0.17%, VLUE’s expenses are lower than 98% of the 1033 Large Cap Value style ETFs and mutual funds under coverage. Coupled with its quality holdings, below average fees make VLUE more attractive and outperformance more likely.
While we recognize that past performance is no guarantee of future results, VLUE’s quality holdings and low costs have led to outperformance relative to its benchmark (IWD) over the past one, three, and five-year periods. VLUE is also the only ETF of the group identified in Figure 3 to outperform the general market (SPY) over the past one-year period and perform inline over the past five-year period. Figure 4 has the details.
Figure 4: iShares Edge MSCI USA Value Factor Trailing Returns
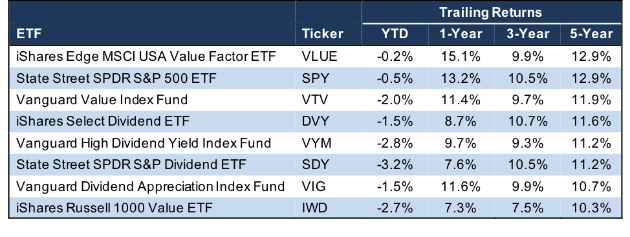
Sources: New Constructs, LLC and Yahoo Finance return data
The Importance of Holdings Based Fund Analysis
Investors have many options when looking to invest in Large Cap stocks. However, one does not have to chase risky momentum strategies or simply buy the largest ETF available. Through diligent holdings analysis, investors can find greater value.
Our Robo-Analyst technology helps perform this diligence by analyzing the holdings of all 2681 Large Cap focused ETFs and mutual funds. Our diligence on holdings led us to an ETF, VLUE, with a portfolio that suggests future performance will be strong.
Each quarter we rank the 11 sectors in our Sector Ratings for ETF & Mutual Funds and the 12 investment styles in our Style Ratings For ETFs & Mutual Funds report. This analysis allows us to find ETFs and mutual funds that investors using traditional fund research may overlook, such as the iShares Edge MSCI USA Value Factor ETF (VLUE).
This article originally published on May 30, 2018.
Disclosure: David Trainer, Kyle Guske II, and Sam McBride receive no compensation to write about any specific stock, style, or theme.
Follow us on Twitter, Facebook, LinkedIn, and StockTwits for real-time alerts on all our research.
[1] Harvard Business School features the powerful impact of our research automation technology in the case New Constructs: Disrupting Fundamental Analysis with Robo-Analysts.
[2] Ernst & Young’s recent white paper “Getting ROIC Right” proves the superiority of our stock research and analytics.