
We’ve written before about how the “earnings recovery” in U.S. equity markets is an illusion. Accounting earnings may have rebounded from 2015 lows, but economic earnings—which reverse accounting distortions and account for the weighted average cost of capital (WACC)—remain in a persistent downturn. Figure 1 shows this trend across the U.S. equity market.[1]
Figure 1: Economic vs. GAAP Earnings
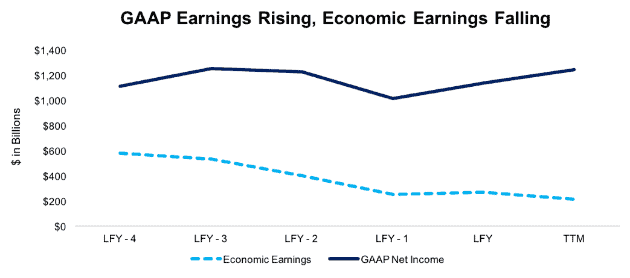
Sources: New Constructs, LLC and company filings.
This disconnect between accounting earnings and economic earnings is not just due to a handful of companies. 6 out of 11 sectors currently have misleading earnings (GAAP rising and economic earnings falling). Just one sector, Technology, saw economic earnings rise over the past twelve months.
The breadth of this decline in economic earnings suggests that the majority of U.S. public companies are unable to earn a return on invested capital (ROIC) greater than their WACC on new investments. The record $2.2 trillion in excess cash sitting on corporate balance sheets offers more evidence for the lack of profitable investment opportunities.
As Figure 2 shows, the Tech sector has been the lone bright spot in the market. Even still, the economic earnings picture is not as rosy as GAAP earnings would suggest. While GAAP net income has risen 23% since 2015, economic earnings are only up 14%. Tech companies also have the most excess cash of any sector at $1.1 trillion, a sign that they are also struggling to find growth opportunities.
Figure 2: Economic vs. GAAP Earnings: Information Technology
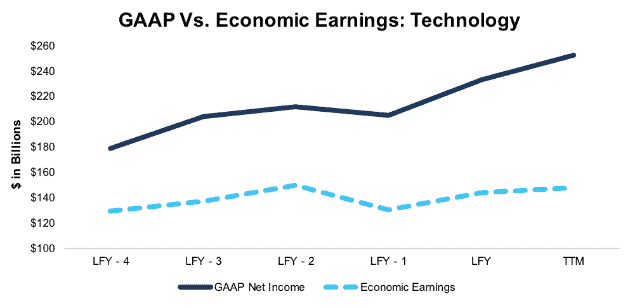
Sources: New Constructs, LLC and company filings.
Figure 2 explains why tech has been at the forefront of the bull market. It’s been the only option for investors that want real earnings growth.
For example, Texas Instruments (TXN) has been one of the top performing tech stocks over the past five years. Its economic earnings have grown by 262% since 2012 compared to 159% growth in net income. Up 255%, the stock price has more closely followed economic earnings over that time.
However, many investors still seem all too willing to buy into the illusory earnings growth in the rest of the market. Sectors with falling economic earnings such as Financials, Industrials, and Basic Materials all saw 20+% gains in 2017 on the back of misleading GAAP net income growth.
The disconnect between accounting and economic earnings in the market stems from two primary issues:
- Managers exploit accounting loopholes to overstate reported profits. GAAP net income has grown 12% over the past five years for the companies in Figure 1, but net operating profit after tax (NOPAT) is up only 9% over that timeframe.
- GAAP earnings overlook balance sheets and ignore the cost of equity capital. Over the past five years, the companies in Figure 1 have increased their balance sheets, i.e. invested capital, by 30%. Their weighted average cost of capital (WACC) is up from 5.0% to 5.9% over the same time. Accordingly, economic earnings decline when the cost and amount of capital rise.
Economic earnings equal NOPAT – (WACC*Invested Capital). When NOPAT grows slower than net income while invested capital and WACC grow faster, that’s a recipe for declining economic earnings. Figure 3 details the adjustments we made to calculate the current NOPAT and invested capital values for the whole market.[2]
Figure 3: Reconciling GAAP Earnings with Economic Earnings: NOPAT and Invested Capital
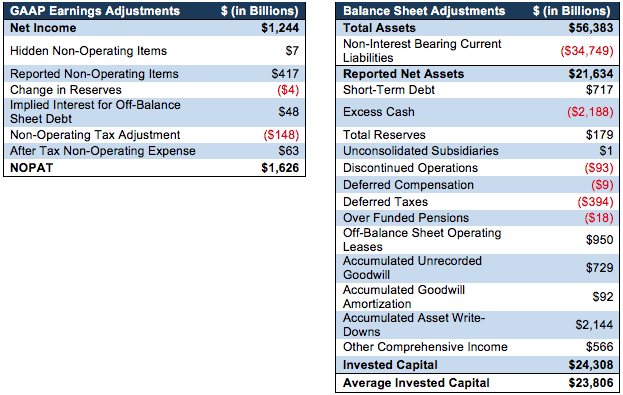
Sources: New Constructs, LLC and company filings.
Our biggest adjustment on the NOPAT side is to strip out non-operating items that are reported directly in the financial statements, such as interest expense, preferred dividends, and minority interest income. Our Robo-Analyst also uncovered a net $7 billion in non-operating expenses hidden in the footnotes.
On the balance sheet side, we added back $2.1 billion in accumulated asset write-downs that companies had tried to scrub off their balance sheet. Adding back accumulated write-downs holds companies accountable for all the capital invested in the business.
Only by making these adjustments can you reverse accounting distortions and reveal true profitability[3].
Figures 4-13 show the impact of our adjustments by comparing economic earnings to GAAP net income for each sector.
Basic Materials Sector
GAAP earnings show a large rebound after the commodities rout caused significant write-downs in 2015. Economic earnings show that this sector still has a long road ahead to recovery. Mining company Freeport-McMoRan (FCX) is an example of a company that rebounded to GAAP profitability this year even though it had economic losses of $2.1 billion.
Figure 4: Economic vs. GAAP Earnings: Basic Materials
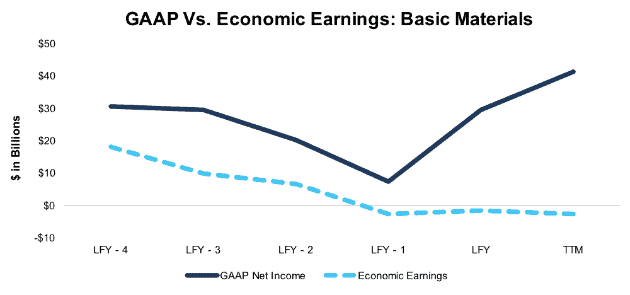
Sources: New Constructs, LLC and company filings.
Consumer Cyclicals Sector
Part of the significant gap between GAAP net income and economic earnings for the Consumer Cyclicals sector can be explained by off-balance sheet operating leases that constitute a hidden form of invested capital. Operating leases account for 9% of all invested capital in the sector, compared to just 4% for the whole market.
Figure 5: Economic vs. GAAP Earnings: Consumer Cyclicals
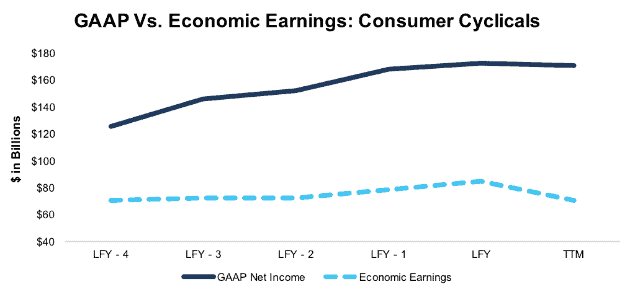
Sources: New Constructs, LLC and company filings.
Consumer Non-Cyclicals Sector
The disconnect between net income and economic earnings has widened significantly over the past few years. Trailing twelve months net income is 25% higher than it was five years ago, while economic earnings are 15% lower. Procter & Gamble (PG) has grown net income by 38% since 2013 while economic earnings are down 24%, which explains why it’s been targeted by activist investor Nelson Peltz.
Figure 6: Economic vs. GAAP Earnings: Consumer Non-Cyclicals
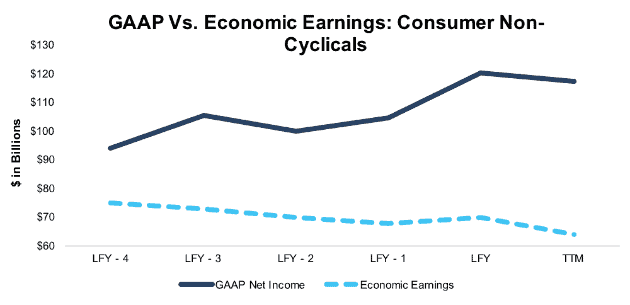
Sources: New Constructs, LLC and company filings.
Energy Sector
While the Energy sector returned to GAAP profitability this year, Figure 4 shows economic earnings still remain far away from breaking even.
Figure 7: Economic vs. GAAP Earnings: Energy
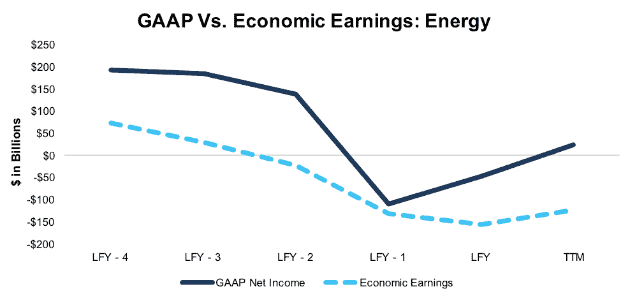
Sources: New Constructs, LLC and company filings.
Financials Sector
The Financials sector has only earned positive economic earnings on aggregate in one of the past six years. The past twelve months have seen the divergence between GAAP and economic earnings widen even further, as GAAP earnings are up 4% from 2016 while economic losses have more than doubled
Figure 8: Economic vs. GAAP Earnings: Financials
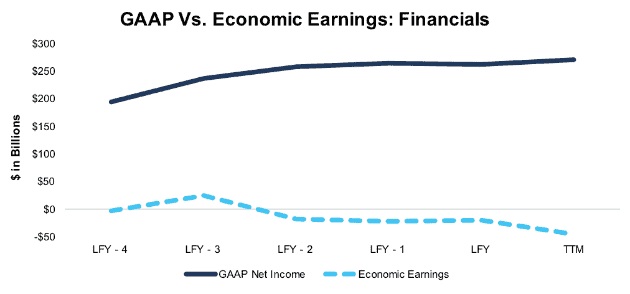
Sources: New Constructs, LLC and company filings.
Healthcare Sector
Other than a brief uptick in 2016, economic earnings in the healthcare sector have been in a steady decline. After a period of divergence, GAAP earnings are declining closer to the level of economic earnings. Health insurer Aetna (AET) saw economic earnings swing to a loss in 2017 while GAAP net income also declined sharply, which explains why it needed to merge with CVS (CVS).
Figure 9: Economic vs. GAAP Earnings: Healthcare
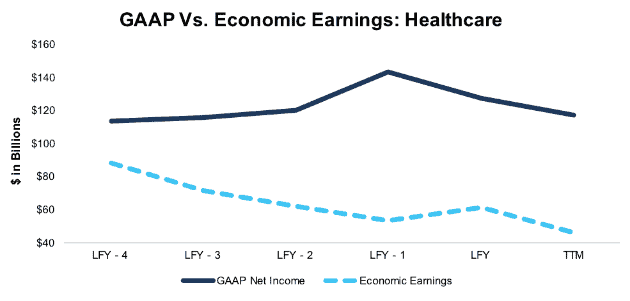
Sources: New Constructs, LLC and company filings.
Industrials Sector
Few sectors have as wide a divergence as Industrials. GAAP earnings continue a steady increase even as economic earnings are down 32% from their 2016 levels over the past twelve months. Waste Connections (WCN) has seen big stock gains and net income growth from its acquisition of Progressive Waste Solutions, but economic earnings have declined. WCN’s reported earnings and valuation moving in the opposite direction of its true profitability earn the stock our Very Unattractive rating.
Figure 10: Economic vs. GAAP Earnings: Industrials
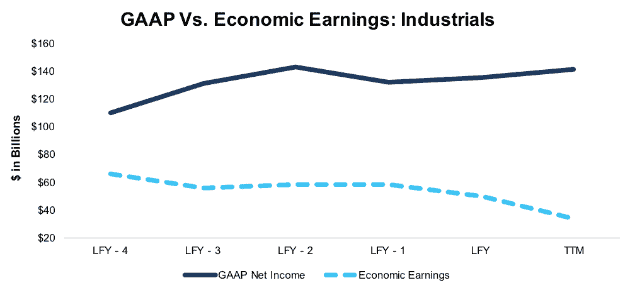
Sources: New Constructs, LLC and company filings.
Real Estate Sector
Real Estate has seen the largest divergence over the past few years. GAAP earnings are 117% higher than they were five years ago even as economic earnings have declined by 34%.
Figure 11: Economic vs. GAAP Earnings: Real Estate
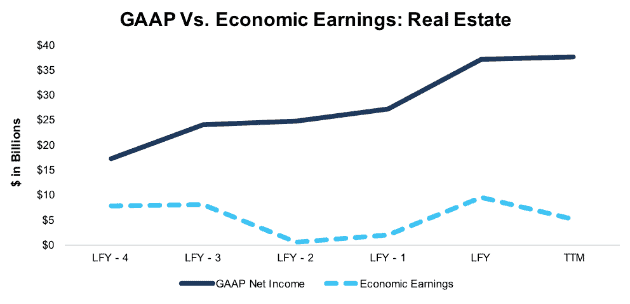
Sources: New Constructs, LLC and company filings.
Telecom Sector
The Telecom sector earns its reputation as an oligopolistic industry. Three large companies in the industry –AT&T (T), Verizon (VZ), and Nippon Telegraph and Telephone (NTTYY)—earned $20 billion in positive economic earnings over the trailing twelve months. The other 35 companies had a combined economic loss of $3 billion.
Figure 12: Economic vs. GAAP Earnings: Telecom
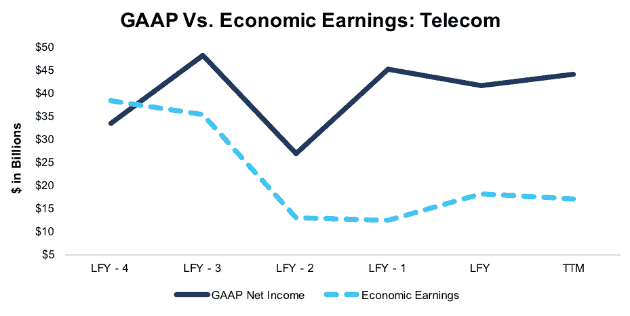
Sources: New Constructs, LLC and company filings.
Utilities Sector
The Utilities sector is another sector with GAAP earnings growth in the double digits even as economic earnings swing to a loss. Almost all the reported growth comes from the fact that GAAP earnings were artificially depressed by write-downs in 2016. NOPAT is flat, while invested capital and the weighted average cost of capital are rising, leading to the decline in economic earnings.
Figure 13: Economic vs. GAAP Earnings: Utilities
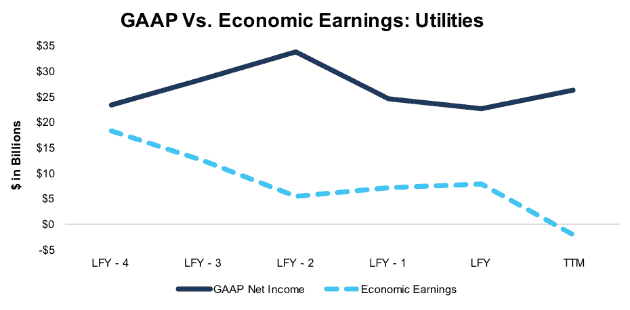
Sources: New Constructs, LLC and company filings.
Cause for Concern
The breadth of the decline in economic earnings should give investors pause. Almost every sector is experiencing this decline, and even for the Technology sector GAAP earnings overstate the profit growth.
Now more than ever it is important for investors to perform their due diligence and find companies that are bucking the trend of rising GAAP earnings and falling economic earnings. These are the stocks that will hold up when this bull market finally does come to an end.
To see our Sector ratings and reports, click here.
Not a Member Yet? You need a Professional Membership or higher to view the content on this page.
Start Your Professional Membership Today | New Constructs Member Login
2 replies to "Only One Sector Has Experienced A True Earnings Recovery"
Procter & Gamble (PG) has grown net income by 38% since 2013 while economic earnings are down 24%, which explains why it’s been targeted by activist investor Nelson Peltz.
If earnings are down why does it make sense that Peltz is targeting it? I didn’t understand that part, any help would be appreciated
Peltz likes to target underperforming companies that could improve their profitability through superior management. P&G’s declining economic earnings are a potential sign of mismanagement.