
We closed this position on November 18, 2020. A copy of the associated Position Update report is here.
In our October 2016 report “4 Stocks to Buy No Matter Who Wins the Presidency,” we noted that Industrials stocks could be poised for a big 2017 on the back of Trump’s focus on fiscal policy. Industrials have looked cheap to us for a while. In eight of past nine quarters, the Industrials sector has ranked within the top three in our Sector Rankings for ETFs and Mutual Funds.
Within the Industrial sector, we have identified a particularly attractive fund that traditional fund research overlooks: Fidelity Select Transportation Portfolio (FSRFX), this week’s Long Idea. In 7 of the last 8 quarters, we have ranked this fund first or second in the Industrials sector.
Quality Stock Selection Can Justify Fees
The only justification for mutual funds to have higher fees than ETFs is “active” management that leads to out-performance. A fund can only outperform if it has higher quality holdings than its benchmark. To determine the quality of holdings, one must analyze each holding in a mutual fund just as our research does.
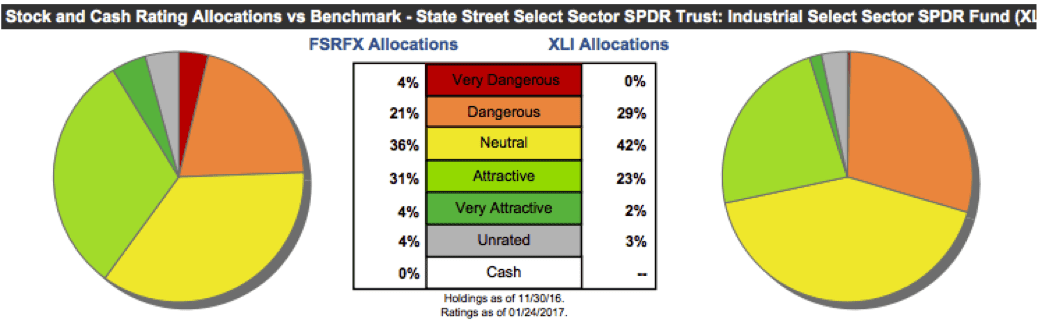
Our research shows, in Figure 1, that Fidelity Transportation allocated more capital to good stocks than its benchmark, the State Street Industrial Select SPDR (XLI).
Specifically, Fidelity Transportation Portfolio allocates 35% of capital to Attractive-or-better rated stocks compared to XLI’s 25%. Meanwhile, Fidelity Transportation avoids riskier stocks in the sector by allocating only 24% of capital to Dangerous-or-worse rated stocks. For comparison, XLI allocates 29% of capital to Dangerous-or-worse rated stocks. Overall, FSRFX allocates more to Attractive-or-better rated stocks and less to Dangerous-or-worse rated stocks than XLI.
Figure 1: Fidelity Select Transportation Portfolio Asset Allocation
Sources: New Constructs, LLC and company filings
Four of the mutual fund’s top 10 holdings receive an Attractive-or-better rating and make up 25% of its portfolio Furthermore, eight of top 10 holdings receive a Neutral-or-better rating and make up nearly 56% of its portfolio.
Because Fidelity Select Transportation holds better stocks than XLI, one can expect the outperformance required to justify higher fees moving forward.
Fidelity Select Transportation Finds Quality Stocks
True value investing still works despite the proliferation of technical and momentum trading. The managers of FSRFX do a good job of finding truly undervalued stocks. This observation is based on our analysis of each of the fund’s holdings for which we model the earnings quality and the future cash flow expectations embedded in the prices of each of the holdings.
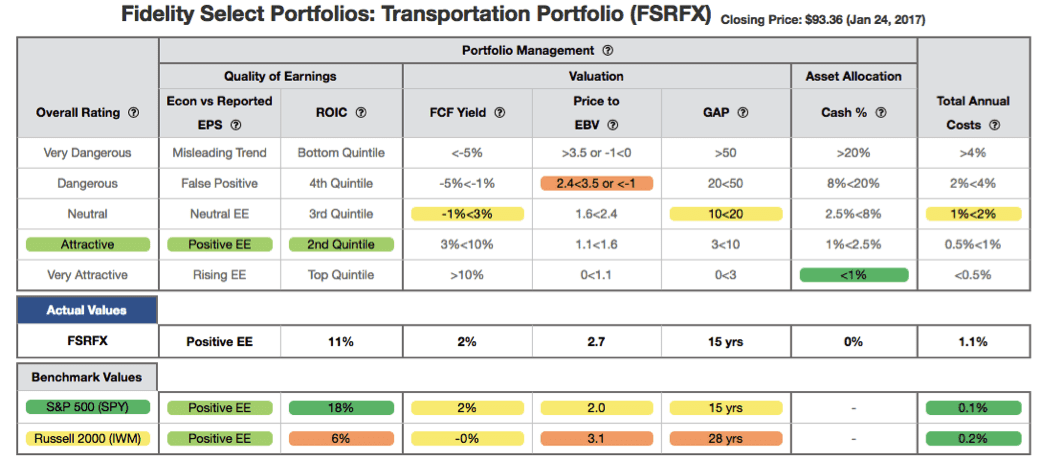
Figure 2 contains our detailed fund rating for FSRFX, which includes each of the criteria we use to rate all funds under coverage. Note that Figure 2 is very similar to our Stock Rating Methodology, because the performance of a fund’s holdings equals the performance of a fund. The results of this analysis reveal important information for investors in Fidelity Select Transportation Portfolio.
Figure 2: Fidelity Select Transportation Portfolio (FSRFX) Rating Breakdown
Sources: New Constructs, LLC and company filings
Our findings from our discounted cash flow valuation of the fund reveal the market implied growth appreciation period (GAP) is 16 years for the State Street Industrial Select SPDR (XLI) and 15 years for the S&P 500 – compared to 15 years for FSRFX. In other words, the market expects the stocks held by FSRFX to grow economic earnings for the same length of time as the S&P 500 and 1 year less than the stocks held by the benchmark.
The return on invested capital (ROIC) of the Fidelity Select Transportation Portfolio is 11%, which is greater than XLI’s 9% ROIC. Essentially, despite being more profitable, the market expects the stocks held by FSRFX to grow economic earnings for a shorter period of time than those held by XLI.
Fidelity Select Transportation Charges Below Average Fees
With total annual costs (TAC) of 1.07%, FRSFX charges less than 69% of Industrials mutual funds under coverage. Coupled with its quality holdings, below average fees make FSRFX more attractive. For comparison, the average TAC of the 16 Industrials mutual funds under coverage is 2.08%, the weighted average is lower at 1.24%, and the benchmark, XLI, charges total annual costs of 0.15%. The difference between FSRFX’s TAC and its reported expense ratio can be seen in Figure 3.
Figure 3: Fidelity Select Transportation’s Cost Comparison

Sources: New Constructs, LLC and company filings
The 0.17 percentage point difference between TAC and expense ratio is minimal especially when compared to comparable Industrials mutual funds. Very Dangerous rated fund, ICON Industrials (ICIAX), has a 2.64 percentage point difference. While not perfect, Fidelity Select Transportation’s expense ratio does a much better job of representing the true costs of investing in the fund. In depth analysis of FSRFX’s TAC is on page 2 here.
To justify its higher fees, the Fidelity Select Transportation Portfolio must outperform its benchmark (XLI) by the following over three years:
- FSRFX must outperform by 0.91% annually.
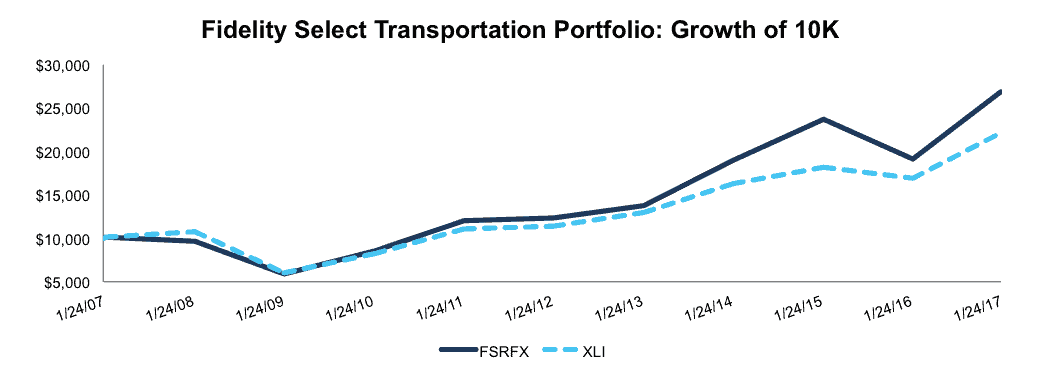
The outperformance that excessive fees require (for investors to get their money’s worth) is not only minimal, but has been surpassed over the past decade, per Figure 4. We also recognize that past performance is no indicator of future success, but Fidelity Select Transportation’s managers’ ability to allocate capital to quality holdings has clearly led to outperformance.
Ultimately, the underlying fundamentals of FSRFX’s holdings along with the low market expectations embedded in their stock prices provide excellent opportunity for outperformance moving forward.
Figure 4: Fidelity Select Transportation vs. XLI
Sources: New Constructs, LLC and company filings.
The Importance of Holdings Based Fund Analysis
The analysis above shows that investors have options if they’re looking to invest in the Industrials sector. Furthermore, Fidelity Select Transportation Portfolio is able to justify its fees through high quality asset allocation, which is the only reason to pay fees above the ETF benchmark.
More Fund Research That Does A Deep Dive Into Holdings
Each quarter we rank the 10 sectors in our Sector Ratings for ETF & Mutual Funds and the 12 investment styles in our Style Ratings For ETFs & Mutual Funds report. This analysis allows us to find funds that investors using traditional fund research may overlook, such as Fidelity Select Transportation Fund.
This article originally published here on January 27, 2017.
Disclosure: David Trainer, Kyle Guske II, and Kyle Martone receive no compensation to write about any specific stock, sector, style, or theme.
Click here to download a PDF of this report.
Scottrade clients get a Free Gold Membership ($588/yr value) as well as 50% discounts and up to 20 free trades ($140 value) for signing up to Platinum, Pro, or Unlimited memberships. Login or open your Scottrade account & find us under Quotes & Research/Investor Tools.
Photo Credit: Simon Cunningham (Flickr)