
Value investing is on the ropes. At least, that’s what you’d think reading articles like this one that highlight how “value” has underperformed “growth” in recent years. I put those words in quotes, partly because the distinction between value and growth is somewhat arbitrary, and also because the critics of value investing tend to attack metrics that have no real connection to shareholder value creation.
Patrick O’Shaughnessy did a great job of attacking this myth on his blog, The Investor’s Field Guide. He points out that, over the last ten years, investors that have bought the cheapest stocks based on price to accounting book value have significantly underperformed. As we recently pointed out, book value relies upon flawed accounting metrics, diminishing its usefulness for investors.
Unfortunately, most of the “value” indexes that people reference, such as the Russell 3000 Value Index, are based primarily off of price to book. As O’Shaughnessy points out, the performance of value strategies varies greatly depending on which metric you use. If you picked the cheapest stocks based on earnings, you did poorly in 2015 but slightly overperformed over the last decade. Stocks with the cheapest price to sale ratios have done very well recently.
Despite their superior recent performance, these metrics have their own problems. We’ve pointed out many times how price to earnings ratios are inherently flawed and have almost no relationship with actual value. The sales number is at least less easy for executives to manipulate, but it also ignores structural margin differences and the impact of the balance sheet.
What’s The Solution?
Investors looking for value need to take a holistic approach that measures a company’s ability to deliver economic earnings to investors and quantifies the expectations for future cash flows embedded in its current stock price.
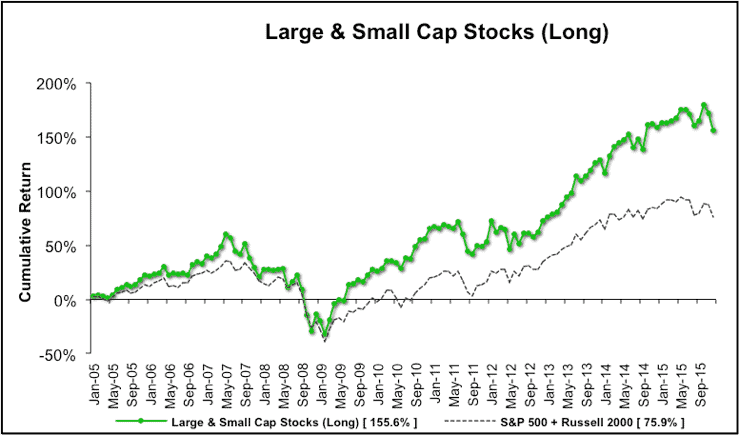
This is what New Constructs aims to do, and while that process is not easy, it can be rewarding, as shown by the long-term outperformance of our strategies. As you can see from Figure 1, over the past decade our Most Attractive Large and Small Cap stocks have outperformed a combination of the S&P 500 and Russell 2000 by 80%.
Figure 1: Most Attractive Stocks Outperform
Sources: New Constructs, LLC and company filings.
The diligence we do helps us to uncover hidden gems that might not show up in simplistic, traditional value screens, such as computer chip manufacturer NVIDIA (NVDA). When we highlighted NVDA as a long idea in September, it had a P/E of 24 and a P/B of 3. Hardly numbers that are going to make your “average” value investor salivate.
However, a closer look showed that these numbers were misleading. For one, NVDA’s reported income was artificially depressed by a $60 million write-down hidden in the footnotes. Plus, the company earns a fantastic return on invested capital (ROIC) of 34%, demonstrating its competitive advantage and its ability to efficiently allocate capital.
After making adjustments to determine the true earnings quality and quantifying the market’s expectations for future cash flows, we saw that NVDA had a price to economic book value (PEBV) of just 1.1, implying that the market believed the company would only grow after tax operating profit (NOPAT) by 10% for the remainder of its corporate life. For a company that had just doubled its NOPAT the year before, those expectations seemed awfully low.
Sure enough, the market has adjusted its expectations for NVDA in the past few months, driving the stock up 25% even as the S&P 500 has fallen by 2%. When the markets get volatile, it’s the real value stocks, the ones with economic profits and low market expectations, that thrive. Meanwhile, the imposters get exposed.
Avoiding Value Traps and Imposters
Succeeding in a struggling market is as much about avoiding the bad stocks as it is about picking the good ones. Our research helps clients avoid “value traps” that seem like they might be cheap on the surface but are actually significantly overvalued when you look a little closer.
One such value trap we warned investors about was Olin Corporation (OLN) back in June of 2014. The stock had a P/E of 13 and a P/B of 2 at the time, but those numbers were highly misleading. Hidden non-operating items boosted its reported earnings by $25 million.
Plus, the company was facing obvious headwinds in the form of falling commodity prices for its chemicals division and an unsustainably high level of demand for its Winchester ammunition segment. Despite this fact, the market was expecting that OLN grow NOPAT by 5.5% for 35 years, an unrealistically long timeframe for such a weak and highly commoditized business.
OLN was able to coast by on its inflated accounting earnings when the market was strong, but that all changed after the S&P 500 hit its peak in the spring of 2015. Since then, the stock’s been in free fall, and it’s now down 42% from when we made our Danger Zone call.
Investors that pick stocks like OLN and ignore ones like NVDA due to simplistic metrics are not truly value investors. In a buyer-beware system like our market, you need to understand how to separate real value-investing research from the imposters. True value investing means performing your due diligence to understand the real economics of the underlying business and the profits it will have to achieve in the future to justify its stock price. Only by doing this hard work can investors uncover value and protect their portfolio.
Disclosure: David Trainer and Sam McBride receive no compensation to write about any specific stock, sector, style, or theme.
Click here to download a PDF of this report.
Photo Credit: Jim Makos (Flickr)