
We closed the BOX pick on September 24, 2024. A copy of the associated Position Close report is here.
We published an update on TSLA on January 27, 2022. A copy of the associated Earnings Update report is here.
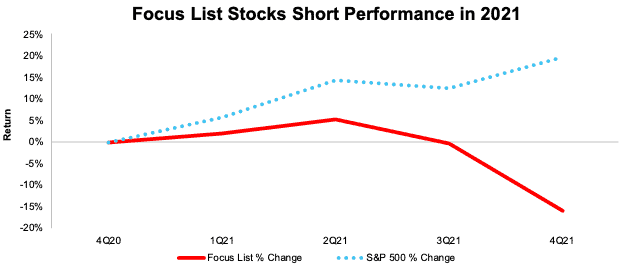
Our Focus List Stocks: Short Model Portfolio outperformed the S&P 500 as a short portfolio by 36% in 2021, and 29 out of our 31 picks outperformed. We’re starting 2022 by reviewing the two stocks that underperformed last year and their potential returns this year. Next week, we’ll review our best performers from 2021.
Tesla Inc. (TSLA: $1,200/share) and Box Inc. (BOX: $26/share) were the only two Focus List Short stocks that underperformed as shorts in 2021, and we remain bearish on both stocks.
Focus List Short Stocks Outperformed in 2021
The Focus List Stocks: Short Model Portfolio contains the best of our Danger Zone picks and leverages superior fundamental data, as proven in The Journal of Financial Economics[1], which provides a new source of alpha. This Model Portfolio is available to Pro and higher members.
The Focus List Stocks: Short Model Portfolio fell[2], on average, -16% in 2021 compared to an average return of 20% for the S&P 500, per Figure 1.
Figure 1: Focus List Stocks: Short Model Portfolio Performance from Period Ending 4Q20 to 4Q21
Sources: New Constructs, LLC
Because our Focus List Stocks: Short Model Portfolio represents the best of the best picks, not all Danger Zone picks we publish make the Model Portfolio. We published 46 Danger Zone Reports in 2021 but added just 11 of those picks to the Focus List Stocks: Short Model Portfolio during the year. Currently, the Focus List Stocks: Short Model Portfolio holds 28 stocks.
Figure 2 shows a more detailed breakdown of the Model Portfolio’s performance, which encompasses all the stocks that were in the Model Portfolio at any time in 2021.
Figure 2: Performance of Stocks in the Focus List Stocks: Short Model Portfolio in 2021
Sources: New Constructs, LLC
Performance includes the performance of stocks currently in the Focus List Stocks: Short Model Portfolio, as well as those removed during the year, which is why the number of stocks in Figure 2 (31) is higher than the number of stocks currently in the Model Portfolio (28).
Below we detail the expectations for future profit growth baked into each of the two stocks, and why we believe each of them is overvalued.
Underperforming Focus List Short Stock 1: Tesla (TSLA): Up 50% vs. S&P 500 Up 27% in 2021
We originally added Tesla to our Focus List Stocks: Short Model Portfolio in November 2017, and while it underperformed as a short in 2021, its valuation remains disconnected from the reality of the firm’s fundamentals and the electric vehicle (EV) market at large. See our most recent report on Tesla here.
Main Reason for Short Underperformance: Irrational Investor Exuberance: Tesla bulls continue to pile into the stock on the hopes Tesla will revolutionize not just the auto industry, but energy, software, transportation, insurance, and more, despite evidence to the contrary as we detail in our report here. The optimistic hopes for these businesses seem to compel investors to buy shares at valuations more suited to science-fiction than investing.
Tesla’s record vehicle deliveries were a major factor in stock performance in 2021. Selling just under 1 million cars in 2021 sounds great and was no small feat. However, that number is minuscule compared to the number of vehicles Tesla must sell to justify its current stock price – anywhere from 16 million to upwards of 46 million depending on average selling price (ASP) assumptions. For reference, Adam Jonas, a Morgan Stanley analyst, projects Tesla will sell 8.1 million vehicles in 2030.
Why We Remain Bearish on Tesla: Valuation Ignores Weakening Competitive Position: The headwinds Tesla faces are numerous (such as the recent recall of half a million vehicles) and outlined in more detail in our report here. The biggest challenge to any Tesla bull case is the rising competition from incumbents and startups alike across the global EV market.
Incumbent automakers have spent billions of dollars building out their EV offerings. Indeed, automakers other than Tesla already account for 85% of global EV sales through the first half of 2021. The global EV market is simply not big enough for Tesla to achieve the sales expectations in its valuation unless everyone else exits the market.
The bottom line is that it is hard to make a straight-faced argument that in a competitive market, Tesla can achieve the sales its valuation implies.
Reverse DCF Math: Valuation Implies Tesla Will Own 60%+ of the Global Passenger EV Market
At its current average selling price (ASP) per vehicle of ~$51k, Tesla’s stock price of ~$1,200/share implies the firm will sell 16 million vehicles in 2030 versus ~930k in 2021. That represents 60% of the projected base case global EV passenger vehicle market in 2030 and the implied vehicle sales based on lower ASPs look even more unrealistic.
To provide inarguably best-case scenarios for assessing the expectations reflected in Tesla’s stock price, we assume Tesla achieves profit margins twice as high as Toyota Motor Corp (TM) and quadruples its current auto manufacturing efficiency. Below are the number of vehicles Tesla needs to sell in 2030 to justify ~$1,200/share.
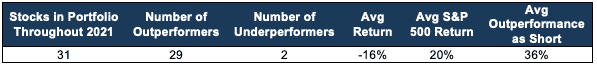
Per Figure 3, Tesla’s current valuation implies that, in 2030, it will sell the following number of vehicles based on these ASP benchmarks:
- 16 million vehicles – current ASP of $51k
- 21 million vehicles – ASP of $38k (average new car price in the U.S. in 2020)
- 46 million vehicles – ASP of $17k (equal to General Motors over the TTM)
If Tesla achieves those EV sales, the implied market share for the company would be the following (assuming global passenger EV sales reach 26 million in 2030, the base case projection from the IEA):
- 60% for 16 million vehicles
- 80% for 21 million vehicles
- 179% for 46 million vehicles
If we assume the IEA’s best case for global passenger EV sales in 2030, 47 million vehicles, the above vehicle sales represent:
- 33% for 16 million vehicles
- 44% for 21 million vehicles
- 98% for 46 million vehicles
Figure 3: Tesla’s Implied Vehicle Sales in 2030 to Justify Current Valuation
Sources: New Constructs, LLC and company filings
Tesla Must be More Profitable Than Apple For Investors to Make Money
Here are the assumptions we use in our reverse discounted cash flow (DCF) model to calculate the implied production levels above.
To justify its current price of ~$1,200/share, Tesla must:
- immediately achieve a 17.2% NOPAT margin (double Toyota’s margin, which is the highest of the large-scale automakers we cover), compared to Tesla’s TTM margin of 7.7%) and
- grow revenue by 38% compounded annually for the next decade.
In this scenario, Tesla generates $789 billion in revenue in 2030, which is 103% of the combined revenues of Toyota, General Motors, Ford (F), Honda Motor Corp (HMC), and Stellantis (STLA) over the TTM.
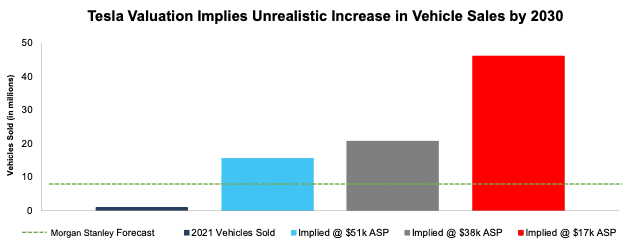
This scenario also implies Tesla generates $136 billion in net operating profit after-tax (NOPAT) in 2030, or 46% higher than Apple’s (AAPL) fiscal 2021 NOPAT, which, at $93 billion, is the highest of all companies we cover.
TSLA Has 59% Downside If Morgan Stanley Is Right About Sales
If we assume Tesla reaches Morgan Stanley’s estimate of selling 8.1 million cars in 2030 (which implies a 31% share of the global passenger EV market in 2030), at an ASP of $38k, the stock is worth just $471/share. Details:
- NOPAT margin improves to 17.2% and
- revenue grows 27% compounded annually over the next decade, then
the stock is worth just $471/share today – 59% downside to the current price. See the math behind this reverse DCF scenario. In this scenario, Tesla grows NOPAT to $60 billion, or nearly 17x its TTM NOPAT, and just 3% below Alphabet’s (GOOGL) TTM NOPAT.
TSLA Has 88%+ Downside Even with 28% Market Share and Realistic Margins
If we estimate more reasonable (but still very optimistic) margins and market share achievements for Tesla, the stock is worth just $136/share. Here’s the math:
- NOPAT margin improves to 8.5% (equal to General Motors’ TTM margin, compared to Tesla’s TTM margin of 7.7%) and
- revenue grows by consensus estimates from 2021-2023 and
- revenue grows 20% a year from 2024-2030, then
the stock is worth just $136/share today – an 88% downside to the current price.
In this scenario, Tesla sells 7.3 million cars (28% of the global passenger EV market in 2030) at an ASP of $38k. We also assume a more realistic NOPAT margin of 8.5% in this scenario. Given the required expansion of plant/manufacturing capabilities and formidable competition, we think Tesla will be lucky to achieve and sustain a margin as high as 8.5% from 2021-2030. If Tesla fails to meet these expectations, then the stock is worth less than $136/share.
Figure 4 compares the firm’s historical NOPAT to the NOPAT implied in the above scenarios to illustrate just how high the expectations baked into Tesla’s stock price remain. For additional context, we show Toyota’s, General Motors’, and Apple’s TTM NOPAT.
Figure 4: Tesla’s Historical and Implied NOPAT: DCF Valuation Scenarios
Sources: New Constructs, LLC and company filings
Each of the above scenarios assumes Tesla’s invested capital grows 14% compounded annually through 2030. For reference, Tesla’s invested capital grew 53% compounded annually from 2010-2020 and 29% compounded annually from 2015-2020. Invested capital at the end of 3Q21 grew 21% year-over-year (YoY). Tesla’s property, plant, and equipment has grown even faster, at 58% compounded annually, since 2010.
A 14% CAGR represents 1/4th the CAGR of Tesla’s property, plant, and equipment since 2010 and assumes the company can build future plants and produce cars 4x more efficiently than it has so far.
In other words, we aim to provide inarguably best-case scenarios for assessing the expectations for future market share and profits reflected in Tesla’s stock market valuation.
Underperforming Focus List Short Stock 2: Box Inc. (BOX): Up 45% vs. S&P 500 Up 27% in 2021
We originally added Box to the Focus List Stocks: Short Model Portfolio in November 2020, and despite the stock’s underperformance as a short in 2021, Box’s business continues to lag in an industry filled with large and well-established incumbent operators. The stock price increase in 2021 puts Box shareholders in a more precarious situation than they were in our most recent Danger Zone report on the company.
Main Reason for Short Underperformance: Box Returned to Growth: Box beat both top and bottom line in each of its quarterly earnings reports in 2021. After years of slowing revenue growth rates, Box reported YoY revenue growth of 10%, 12% and 14% in fiscal 1Q22, 2Q22, and 3Q22 respectively. In its fiscal 3Q22 earnings report, Box guided for YoY revenue growth of 15% in fiscal 4Q22, which was above consensus estimates of 12% YoY revenue growth.
This return to growth comes at a time when demand for file sharing, collaboration tools, and cloud content storage/management is rising as companies adapt to hybrid work models.
Why Box Remains Boxed Out: Not Profitable In Best of Times: Despite a return to growth, Box remains unprofitable in a cloud/software industry filled with more profitable competitors.More details on Box’s competition are in our report here.
The fact remains thatmost of Box’s target customers already get Box-like services from Microsoft (MSFT), Apple (AAPL), or Google (GOOG), who also offer high-value products such as word processing, spreadsheet/data management, and video conferencing tools. In comparison, Cloud storage is a low-value add-on, and collaboration tools are becoming more ubiquitous.
Box pitches direct integration with Microsoft, Google, and other partners as a selling point. However, once a user is paying for Microsoft and Google, why would they want to pay extra to use an outside app to edit and manage files when they get the same service from within Microsoft and Google?
With this competitive backdrop, bulls should heed caution given that Box’s busines remains unprofitable in, perhaps, one of the best times to be a provider of cloud storage and related software.
Over the TTM, Box’s operating expenses remain 104% of revenue. Per Figure 5, Box’s NOPAT margin of -3% is well below its competitors. Box’s invested capital turns, a measure of balance sheet efficiency, fall in the middle of the group, and Box’s ROIC ranks last as the only negative ROIC of the group as well.
Figure 5: Box’s Partners/Competitors Are More Profitable – TTM
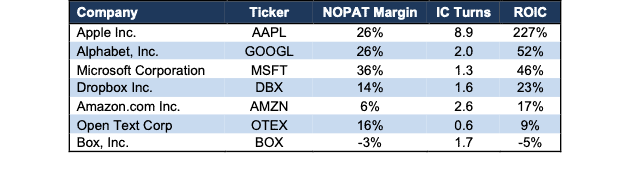
Sources: New Constructs, LLC, and company filings
Box Is Priced to Reach Nearly 56 Million Paying Users, or 340% of Dropbox Paying Users
Given guidance for mid-teens growth rates, investors may think Box has more room to run. However, when we use our reverse DCF model to quantify the expectations for future growth baked into the firm’s stock price, we find that Box must grow at double consensus estimates or the stock holds nothing but downside risk.
To justify its current price of $26/share, Box must:
- immediately improve NOPAT margin to 8% (above Amazon but below larger tech peers, compared to Box’s -3% TTM NOPAT margin) and
- grow revenue by 20% compounded annually (double consensus estimate CAGR over the next four years) for the next seven years.
In this scenario, Box would generate $2.8 billion in revenue in fiscal 2028, which is 3X its TTM revenue and 34% greater than Dropbox’s TTM revenue. By dividing the implied revenue in fiscal 2028 of $2.8 billion by the firm’s fiscal 2021 average revenue per paying user of $50, we arrive at ~56 million implied paying users in fiscal 2028, compared to ~15.5 million in fiscal 2021. 56 million paying users would be 340% of Dropbox’s paying users as well.
In the history of the world, the number of companies that grow revenue by 20%+ compounded annually for such a long period is “unbelievably rare,” which make the expectations baked into Box’s valuation look even more unrealistic.
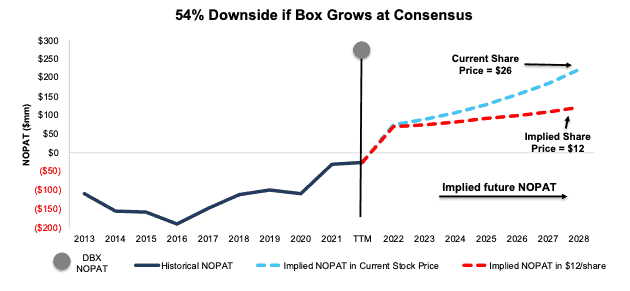
BOX Has 54%+ Downside if Consensus Is Right: Even if we assume Box’s
- NOPAT margin improves to 8% and
- revenue grows at 10% compounded annually (equal to consensus CAGR through fiscal 2024) for the next seven years, then
the stock is worth just $12/share today – a 54% downside to the current price. This scenario still implies Box’s revenue grows to $1.5 billion in fiscal 2028 and its implied paying users would be 30 million, or nearly 2x its fiscal 2021 paying users. If Box fails to achieve the revenue growth or margin improvement assumed in this scenario, the downside would be even higher.
Figure 6 compares Box’s historical NOPAT to the NOPAT implied by each of the above DCF scenarios. For reference, we include Dropbox’s TTM NOPAT as well.
Figure 6: Box’s Historical Vs. Implied NOPAT
Sources: New Constructs, LLC and company filings.
Each of the above scenarios also assumes Box is able to grow revenue, NOPAT, and free cash flow (FCF) without increasing working capital or fixed assets. This assumption is highly unlikely but allows us to create best-case scenarios that demonstrate how high expectations embedded in the current valuation are.
Check out this week’s Danger Zone interview with Chuck Jaffe of Money Life.
This article originally published on January 10, 2022.
Disclosure: David Trainer, Kyle Guske II, and Matt Shuler receive no compensation to write about any specific stock, sector, style, or theme.
Follow us on Twitter, Facebook, LinkedIn, and StockTwits for real-time alerts on all our research.
[1] Our research utilizes our Core Earnings, a more reliable measure of profits, as proven in Core Earnings: New Data & Evidence, written by professors at Harvard Business School (HBS) & MIT Sloan and published in The Journal of Financial Economics.
[2] Performance represents the price performance of each stock during the time in which it was on the Focus List Stocks: Short Model Portfolio in 2021. For stocks removed from the Focus List in 2021, performance is measured from the beginning of 2021 through the date the ticker was removed from the Focus List. For stocks added to the Focus List in 2021, performance is measured from the date the ticker was added to the Focus List through December 31, 2021.
2 replies to "2 Focus List Shorts Poised to Payoff"
Why are some projections based off 7 years while some are based off 10 years? And what is corporate value in the Reverse DCF?
Hi DM!
We develop our valuation scenarios to make our analysis as relevant as possible. For example, if we have a 7-year industry growth forecast from a third party, we may incorporate that amount of time in a DCF valuation scenario to easily compare the growth expectations embedded in company’s stock price vs. the growth expectations for the entire industry.
Corporate Value is the total value of the company as calculated in the reverse discounted cash flow model and is comprised of the present value of a company’s future cash flows. We make numerous valuation adjustments to Corporate Value to arrive at Shareholder Value, which represents the aggregate fair value of a company’s common equity. Thanks for the questions!