We closed this position on November 23, 2020. A copy of the associated Position Update report is here.
Food processing can be a volatile business. Changes in commodity prices, diseases, natural disasters, and trade disputes can all disrupt operations. As a result, solid companies in this industry can face years of poor profitability.
This poultry producer has been one of our top stock picks going back to August of 2015. Since our original call, the stock has outperformed, up 62% vs. 27% for the S&P 500. However, 2018 was a nightmare year for the company and stock. Declining profitability led to our rating system downgrading the stock to Unattractive. All signs point to 2019 being a bounce back year though, which is why we are reiterating Sanderson Farms (SAFM: $120/share) as a Long Idea despite its Unattractive rating.
Can’t Keep SAFM Down for Long
The company’s profits were squeezed from both ends in 2018. Feed costs increased, up 1% from 2017, while the average sales price of its chicken products decreased by 9%. Due to the influence of feed costs on chicken production, it’s rare to see the two prices move in opposite directions. 2018 was only the second year in the past decade where chicken prices fell while feed costs rose.
The impact of these rising costs and falling revenues – combined with startup costs for a new production facility and the impact of two hurricanes on existing facilities – caused SAFM’s after-tax operating profit (NOPAT) margins to fall from 8% in 2017 to 1% in 2018. As a result, return on invested capital (ROIC) fell from 21% to 2% and economic earnings turned negative.
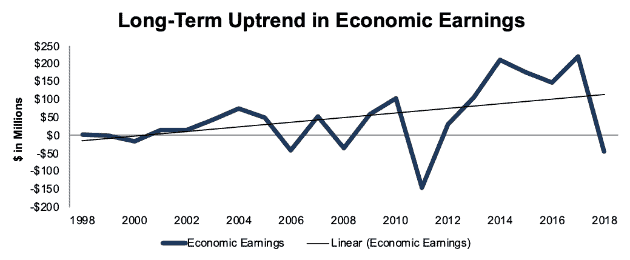
However, as Figure 1 shows, these downturns never last long. Prior to 2018, economic earnings had grown by 15% compounded annually for a decade and 24% compounded annually dating back to 1998.
Figure 1: SAFM Economic Earnings Growth Since 1998
Sources: New Constructs, LLC and company filings
In addition, economic earnings have spent two consecutive years below the trendline only once in the past 20 years. That period was 2011-2012, when a series of global supply shocks led to the cost of grain feed rising nearly 40%.
Shocks on either the supply or demand side have been the cause of previous down periods as well. Economic losses in 2008 were also the result of global supply shocks spiking grain prices. In 2006, it was a combination of overproduction and the fear of avian flu hurting export markets that hurt sales prices.
In 2018, trade was the primary culprit. China had already banned imports of U.S. chicken in 2015 due to avian flu concerns, but U.S. pork and beef producers have long relied on China as a major export market. When tariffs hurt pork and beef exports, it led to oversupply in the U.S. that pushed prices down for all meats, including chicken, even as grain prices rose.
Why a Rebound Looks Likely
Both the rise in feed prices and the decline in chicken prices appear poised to reverse course in 2019. In the Q4 2018 earnings call, CEO Joe Sanderson told analysts, “We expect flat to lower cost during fiscal 2019.” He added that if the company had locked in its grain costs for 2019 on the futures market, their total grain cost would be $8.1 million (~1%) lower than 2018, but that the company believed prices would go even lower.
On the chicken price side, the U.S. Department of Agriculture expects a 1-2% increase in retail poultry prices in 2019.
SAFM should also benefit from lower SG&A and higher production in 2019. The company incurred $13 million (6% of SG&A) in costs in 2018 related to work on its new production facility in Tyler, Texas. Without those startup costs, the company projects SG&A to drop from $222 million in 2018 to $213 (~4%) in 2019. The Tyler facility should begin production in February and help the company grow production by ~3% in 2019.
Taken altogether, SAFM should earn a significantly higher gross margin in 2019 while increasing its sales volume and significantly decreasing SG&A as a % of revenue. These factors should lead to a significant rebound in ROIC and economic earnings.
Economic Earnings Drive Valuation
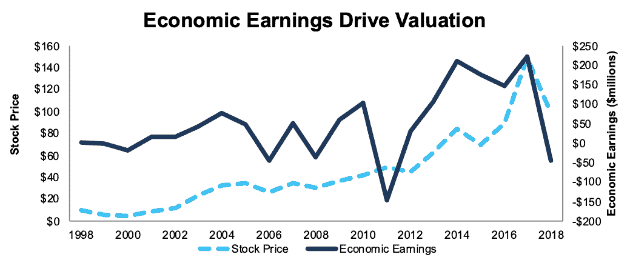
Of course, these factors only matter to investors if ROIC and economic earnings actually drive the stock price. There’s a great deal of evidence that shows ROIC and economic earnings drive valuations throughout the broader market, and Figure 2 shows that this relationship holds true for SAFM. In 15 out of the past 20 years, the stock price has moved in the same direction as economic earnings.
Figure 2: SAFM Economic Earnings and Stock Price Since 1998
Sources: New Constructs, LLC and company filings
The stock has already bounced back up 23% in 2019, which indicates that the market sees economic earnings bouncing back this year. Despite this increase, the stock still has significant upside, as we’ll show later on.
Consistent Production and Demand Growth
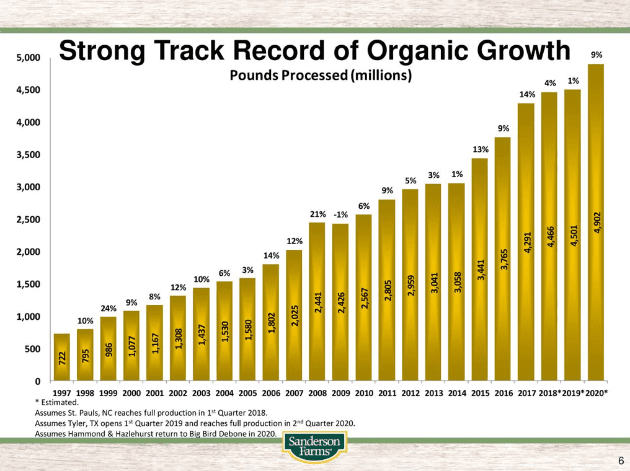
The long-term uptrend in SAFM’s economic earnings comes from its consistent production growth. As Figure 3 shows, SAFM has increased its production by 9% compounded annually from 1997 to 2018.[1] The company increased its pounds processed in all but one year during that span.
Figure 3: SAFM Production Growth Since 1997
Sources: Company Presentation
Volatile commodity prices mean that year-to-year profits will always be variable in this industry, but there’s no reason to believe that the long-term growth trajectory will change.
Superior Capital Turns Provide Competitive Advantage
Chicken production in the U.S. is a highly concentrated industry. The four largest producers – Tyson (TSN), Pilgrim’s Pride (PPC), SAFM, and private company Perdue – account for over 50% of production.
Of this big 4 group, SAFM stands out for the size of the chickens it produces. Its birds have an average live weight of ~8 pounds, compared to ~6 pounds for the other producers. The company writes in its 10-K that it decided in 1997 to focus on medium and large-sized birds for the retail and foodservice industries rather than the smaller birds that are sold to fast food restaurants.
By focusing on larger birds, SAFM’s processing plants are more efficient than its competitors. In 2017, its processing plants produced an average of 7.5 million pounds of ready-to-cook chicken per facility per week, compared to 5.5 million for TSN, 5.9 million for PPC, and 5.7 million for Perdue.
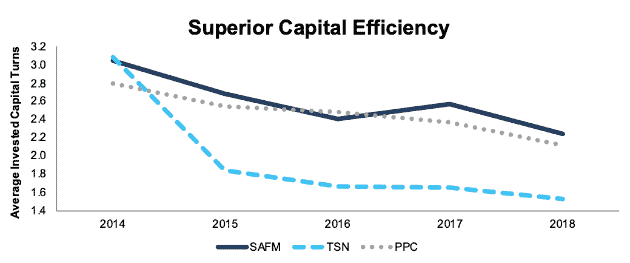
This superior efficiency also shows up in average invested capital turns, the amount of revenue the company generates per dollar invested in the business. Figure 4 shows that, even though capital turns have been in decline for all the major producers recently, SAFM retains an edge over PPC and TSN.
Figure 4: Capital Turns for Big 3 Chicken Producers Since 2014
Sources: New Constructs, LLC and company filings
SAFM’s focus on big birds for the food service industry might make it more susceptible to the types of price shocks we saw in 2018. A large food service provider such as Sysco (SYY) can shift towards serving more beef and pork when those meats become cheaper, whereas a fast food company like Chick-Fil-A can’t exactly start serving burgers.
To compensate for this greater volatility, SAFM has a much more stable balance sheet than its peers. The company’s only debt is $31 million (1% of market cap) in off-balance sheet debt from operating leases. In contrast, both TSN and PPC have long-term debt equivalent to ~50% of their market cap. SAFM’s clean balance sheet allows it to withstand volatile price swings while enjoying superior capital efficiency over the long-term.
Bear Case: Shift Away from Chicken to Red Meat Is Permanent
To believe that SAFM’s (and the entire chicken industry) long-term track record of growth will come to an end, you need to believe that the demand for chicken will grow at a slower rate or even decline in the future. That is, as discussed above, what happened in 2018, as competition from cheaper beef and pork decreased demand for chicken.
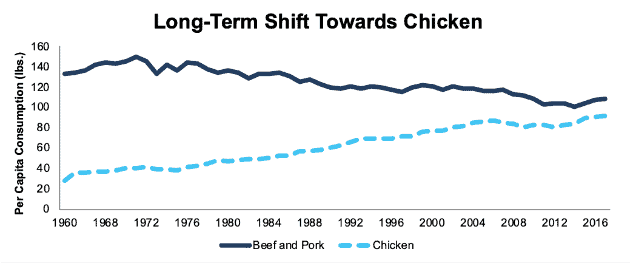
However, it’s hard to argue that 2018 was anything but a blip when one analyzes the long-term trend in consumption for chicken vs. beef and pork. Figure 5 shows that U.S. per capita chicken consumption has more than tripled since 1960 while consumption of beef and pork has declined by 19%.
Figure 5: U.S. Per Capita Consumption of Chicken, Beef, and Pork Since 1960
Sources: USDA
Global demand for chicken continues to grow too, as more and more people in developing countries join the middle class.
It’s clear the trade war has caused temporary issues for chicken producers. It’s possible that prices haven’t fully adjusted and SAFM’s profitability could rebound slower than it has in the past. Even if the rebound is slower than usual, it will only a blip in the long-term trend of growing chicken demand.
On the other hand, if the U.S. can come to agreements with China and Mexico, chicken prices could rebound much more rapidly than expected, and SAFM could regain access to export markets that were previously closed.
Undervalued Compared to Peers
Numerous case studies show that getting ROIC right[2] is an important part of making smart investments. Ernst & Young published a white paper that proves the material superiority of our forensic accounting research and measure of ROIC. The technology that enables this research is featured by Harvard Business School.
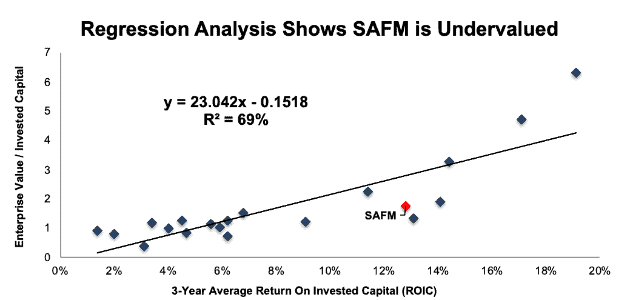
Since annual ROIC can be so volatile, we used three-year average ROIC to compare SAFM to its peers. Per Figure 6, three-year average ROIC explains 69% of the difference in valuation for the 20 companies listed as peers in SAFM’s proxy statement.
Figure 6: 3-Year Average ROIC Explains 69% of Valuation for SAFM Peers
Sources: New Constructs, LLC and company filings
At its current valuation, the market expects SAFM’s long-term ROIC to decline from its three-year average of 13% to 7%. SAFM has earned an average ROIC of 12% dating back to 1998, so it seems unlikely that such a significant long-term decline will take place.
If SAFM were to trade at parity with its peers, the stock would be worth ~$210/share today, a 78% upside from the current stock price.
Cheap Valuation Create Potential Upside
Due to its low profitability in 2018, SAFM looks expensive based on annual metrics. It has a P/E of 45, and a price to economic book value (PEBV) of 5.7, both well above the S&P 500 average.
However, if we use three-year average NOPAT ($166 million) instead of 2018 NOPAT ($29 million), the stock all of a sudden looks much cheaper. PEBV falls to 0.9, which means that the market expects NOPAT to permanently decline by 10% from its three-year average. For a company with SAFM’s long-term profit growth history, this expectation seems overly pessimistic.
If SAFM can get back to its long-term average ROIC of 12% and grow revenue by 4.5% compounded annually (half its growth rate over the past 20 years) over the next decade, the stock is worth $184/share today, a 50% upside from the current stock price. See the math behind this dynamic DCF scenario.
SAFM has significant upside even if you believe its growth is going to slow down significantly going forward.
What Noise Traders Miss With SAFM
In general, markets aren’t good at identifying quality balance sheet management (i.e capital allocation) that creates value. Instead, due to the proliferation of noise traders, markets are great at amplifying volatility, and therefore risk, in popular momentum stocks, while high-quality unconflicted & comprehensive fundamental research is overlooked. Here’s a quick summary for what noise traders miss when analyzing SAFM:
- Long-term track record of growth despite fluctuations in profitability. Simple P/E or earnings growth screens will exclude SAFM.
- Superior capital efficiency compared to peers.
- Reduced SG&A expense and increased production from new Tyler facility will lead to an even bigger rebound in profits than the rest of the industry.
Trade Resolution, Earnings Surprise Could Provide Upside
The biggest catalyst to push SAFM shares up would be an end to the trade war with China, especially if it included an end to the Chinese ban on imported U.S. poultry.
Absent a trade agreement, earnings surprises could provide upside for SAFM. Despite the positive trends noted above, consensus estimates have revenue growing by less than 2% in 2019 and GAAP EPS falling from $2.70 in 2018 to just $0.49 in 2019.
However, analysts have a poor track record of forecasting earnings. Consensus analyst estimates have been off by more than $0.10/share in each of the past 11 quarters. On the revenue side, analysts have been off by an average of ~$16 million (2%) each quarter over the past two years.
With such low forecasts, SAFM should be well set up for earnings beats that will drive shares higher.
Share Repurchases Plus Dividends Offer 4% Yield
SAFM has increased its dividend in 8 out of the past 10 years. The company’s quarterly dividend has grown from $0.20/share in 2014 to $0.32 in 2018, or 12% compounded annually. The stock currently offers a 1% dividend yield. On top of its quarterly dividend, SAFM has paid a special dividend of up to $1/share in highly profitable years in the past.
In 2018, when the stock dropped over 40% from its peak, SAFM decided that buybacks would be a more effective form of capital return than a special dividend, and the board authorized the repurchase of up to 2 million shares (9% of shares outstanding). This buyback authorization suggests that the company views its shares as undervalued, as SAFM had not bought back shares in either of the prior two years.
The company bought back 884 thousand shares in 2018. This proved to be a good investment, as SAFM’s current stock price of $123/share is 21% above the $101/share average they paid. In total, SAFM spent $83 million on buybacks in 2018 (3%) of market cap. Combined, the buybacks and dividend offer a 4% yield, although that could go much higher if the company buys back shares at a higher rate or offers a special dividend next year.
Executive Compensation Could Be Improved
SAFM’s executive compensation plan, which includes base salary, annual cash incentives, and long-term equity awards, focuses on earnings per share and return on equity (ROE). ROE is a flawed metric, but its flaws aren’t especially significant when it comes to SAFM. ROE’s two biggest issues are that it can be influenced by leverage and accounting loopholes. SAFM, as noted above, has almost no leverage, and it consistently ranks among the companies for which we have to make the fewest adjustments.
We still believe that SAFM would be better served using ROIC, but for now ROE does an adequate job of measuring the company’s profitability.
Insider Trading and Short Interest Trends
There is little insight to be gained from recent insider trading trends, as they have been minimal. Over the past 12 months, 51 thousand shares have been purchased and 111 thousand shares have been sold, for a net sale of 60 thousand shares. These sales represent less than 1% of shares outstanding.
Short interest trends are more insightful. There are currently 3.5 million shares sold short, which equates to 16% of shares outstanding and 7 days to cover. Short interest has fallen 46% over the past year, down from 6.5 million shares sold short and 10 days to cover. A large percentage of shorts covered as the stock dropped over the past year, but there a number of shorts that could still be squeezed with the recent recovery in the stock price.
Critical Details Found in Financial Filings by Our Robo-Analyst Technology
As investors focus more on fundamental research, research automation technology is needed to analyze all the critical financial details in financial filings. Below are specifics on the adjustments we make based on Robo-Analyst[3] findings in Sanderson Farm’s fiscal 2018 10-K:
Income Statement: we made $59 million of adjustments, with a net effect of removing $31 million in non-operating income (1% of revenue). We removed $45 million in non-operating income and $14 million in non-operating expenses. The most notable adjustment was a $38 million benefit from the new tax law. You can see all the adjustments made to SAFM’s income statement here.
Balance Sheet: we made $163 million of adjustments to calculate invested capital with a net decrease of $19 million. You can see all the adjustments made to SAFM’s balance sheet here.
Valuation: we made $94 million of adjustments with a net effect of increasing shareholder value by $94 million. Despite this decrease in valuation, the stock remains undervalued.
Attractive Funds that Hold SAFM
The following fund receives our Attractive-or-better rating and allocates significantly to SAFM.
- First Trust NASDAQ Food & Beverage ETF (FTXG) – 2.2% allocation and Attractive rating.
This article originally published on January 30, 2019.
Disclosure: David Trainer, Kyle Guske II, and Sam McBride receive no compensation to write about any specific stock, style, or theme.
Follow us on Twitter, Facebook, LinkedIn, and StockTwits for real-time alerts on all our research.
[1] Actual 2018 production was 4.503 billion pounds vs. the 4.466 billion estimate shown in Figure 3.
[2] Ernst & Young’s recent white paper “Getting ROIC Right” proves the superiority of our holdings research and analytics.
[3] Harvard Business School features the powerful impact of our research automation technology in the case study New Constructs: Disrupting Fundamentals Analysis with Robo-Analysts.

2 replies to "2019 Should Be a Bounce Back Year for This Food Processor"
Sam. Great thesis. Enjoyed the discussion on economic earnings.
On the reverse DCF. You used a forecast period of 10 years. Is this derived from the market-implied forecast period? If so, is it possible for the expected value forecast period to be different from the market-implied forecast period?
Thanks Sam.
Thanks Jonathan,
The market-implied GAP for SAFM is actually just 1 year in our rating system due to the fact that our model assumes a significant regression to the mean for NOPAT margins.
In terms of the reverse DCF, we typically use a 10-year forecast period when we don’t have any reason to believe that a company will have an especially long or short GAP. Our goal for the reverse DCF is not to forecast the future, since we know we can’t do that. It’s just to quantify what the market expects, and what a company needs to do for shareholders to have upside potential.
For SAFM, if we use the same assumptions for the reverse-DCF but shorten the forecast period to 5 years, we get a fair value of ~$163/share. If we double the forecast period to 20 years, we get ~$232/share.