
AI has been a hot topic for a few years now, yet we all struggle to distinguish truly reliable AI offerings from hallucinating agents. AI, like any model, is only as good as the data on which it is trained. It’s safe to say that AI trained on the internet is not reliable, unless you think the internet is 100% reliable.
Nowhere is this issue more evident than in the realm of investing. Generating alpha is a formidable challenge, to say the least. Teaching an AI to generate alpha at scale is even more challenging.
But challenging doesn’t mean impossible. We accepted that challenge many years ago and created an AI agent for investing that has consistently generated real alpha in the stock market.
And, we share it with you in many forms. We present our Dividend Growth Model Portfolio, which features companies that not only produce ample free cash flow to support their dividend payments, but also have a strong track record of consistently increasing their dividend payments over time.
Below is an overview of one of the stocks from the June edition of our Dividend Growth Model Portfolio. It is not an in-depth Long Idea report, but it will give you a good understanding of how our research combines fundamental research with expectations investing. It’s also a great example of a good dividend stock.
We hope you enjoy this free stock pick. Feel free to share this report with friends and colleagues.
We update this Model Portfolio monthly. June’s Dividend Growth Model Portfolio was updated and published for clients on June 27, 2025.
Free Stock Pick: BOK Financial Corp (BOKF: $101/share)
BOK Financial has grown revenue and net operating profit after-tax (NOPAT) by 9% and 6% compounded annually, respectively, since 2014. The company’s NOPAT margin actually fell from 22% in 2014 to 17% in the TTM, while invested capital turns rose from 0.4 to 0.5 over the same time. Rising invested capital turns are enough to offset falling NOPAT margin and drive return on invested capital (ROIC) from 8.0% in 2014 to 8.4% in the TTM.
Figure 1: BOK Financial’s Revenue & NOPAT Since 2014
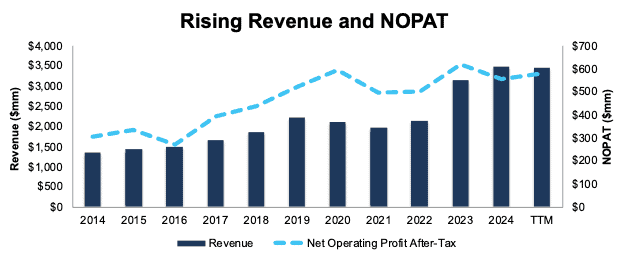
Sources: New Constructs, LLC and company filings
Free Cash Flow Exceeds Dividend Payments
BOK Financial has increased its regular, quarterly dividend from $0.50/share in 1Q19 to $0.57/share in 2Q25. The quarterly dividend, when annualized, equals $2.28/share and provides a 2.2% dividend yield.
More importantly, BOK Financial’s cumulative free cash flow (FCF) easily exceeds its dividend payments. From 2019 through 1Q25, BOK Financial generated $1.6 billion (23% of current enterprise value) in FCF while paying $899 million in dividends. See Figure 2.
Figure 2: BOK Financial’s FCF vs. Dividends Since 2019
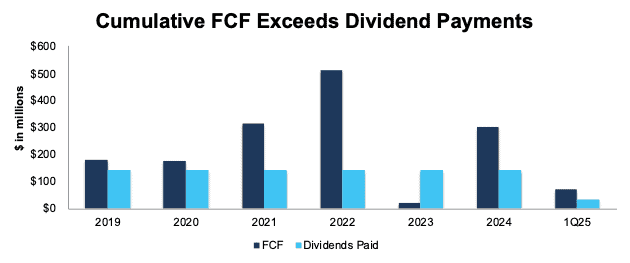
Sources: New Constructs, LLC and company filings
Companies with FCF well above dividend payments provide higher-quality dividend growth opportunities. On the other hand, dividends that exceed FCF cannot be trusted to grow or even be maintained.
BOKF Is Undervalued
At its current price of $101/share, BOK Financial has a price-to-economic book value (PEBV) ratio of 1.0. This ratio means the market expects BOK Financial’s NOPAT to never grow from TTM levels. This expectation seems overly pessimistic given that BOK Financial has grown NOPAT by 2% and 6% compounded annually over the past five and ten years, respectively.
Even if BOK Financial’s:
- NOPAT margin falls to 15% (below five-year average of 23% and TTM margin of 17%) and
- revenue grows 3% compounded annually (below the 9% CAGR over the last five and ten years) for the next decade,
the stock would be worth $121/share today – a 20% upside. In this scenario, BOK Financial’s NOPAT would grow 2% compounded annually through 2034. Contact us for the math behind this reverse DCF scenario.
Add in BOK Financial’s 2.2% dividend yield and a history of dividend growth, and it’s clear why this stock is in June’s Dividend Growth Stocks Model Portfolio.
Critical Details Found in Financial Filings by Our Robo-Analyst Technology
Below are specifics on the adjustments we make based on Robo-Analyst findings in BOK Financial’s 10-K and 10-Q:
Income Statement: we made over $50 million in adjustments with a net effect of removing under $40 million in non-operating expense. Clients can see all adjustments made to the BOK Financial’s income statement on the GAAP Reconciliation tab on the Ratings page on our website.
Balance Sheet: we made over $1 billion in adjustments to calculate invested capital with a net increase of under $800 million. The most notable adjustment was for other comprehensive income. See all adjustments made to BOK Financial’s balance sheet on the GAAP Reconciliation tab on the Ratings page on our website.
Valuation: we made over $400 million in adjustments, all of which decreased shareholder value. The most notable adjustment to shareholder value was total debt. See all adjustments to BOK Financial’s valuation on the GAAP Reconciliation tab on the Ratings page on our website.
This article was originally published on July 2, 2025.
Disclosure: David Trainer, Kyle Guske II, and Hakan Salt receive no compensation to write about any specific stock, style, or theme.
Questions on this report or others? Join our online community and connect with us directly.