We closed this position on February 22, 2018. A copy of the associated Position Update report is here.
This firm is a leading supplier of networking equipment and software that are critical to the functionality and security of internet-based applications in an increasingly mobile world. The firm’s fundamentals are solid, with steady revenue and profit growth combined with a consistently rising ROIC that is well above peers. However, unlike many tech stocks that generate no profits, this stock has lagged over the past year.
Future profit expectations embedded in the stock price look overly conservative in light of historical performance and the firm’s solid competitive position in a growing market. As a result, we believe the stock presents an attractive value proposition in a sector where value is increasingly hard to come by. F5 Networks (FFIV: $116/share) is this week’s Long Idea.
Consistent Revenue and Profit Growth
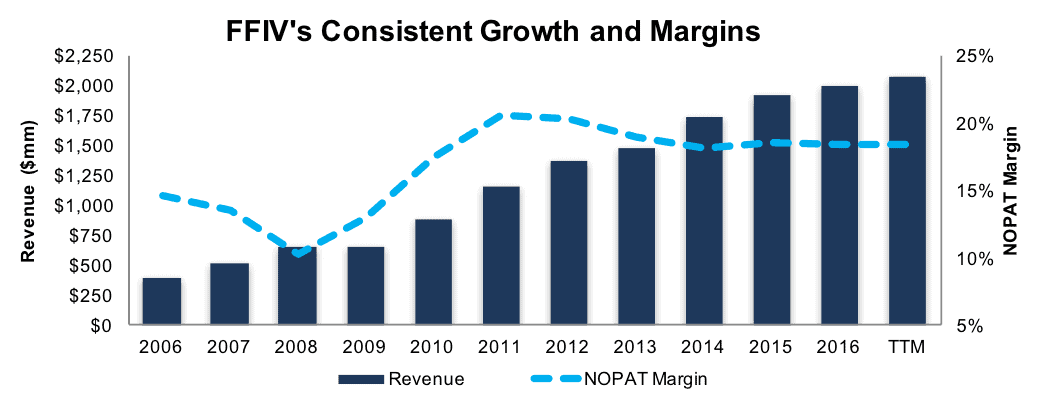
FFIV has grown revenue by 15% compounded annually over the past decade. After-tax profits (NOPAT) have grown 19% compounded annually over the same period due to an improvement in NOPAT margins from 14% in 2007 to 18% over the trailing twelve months (TTM). Over the past three years, revenue growth has moderated to 6% compounded annually. NOPAT has grown at a slightly faster 7% compounded annually over the past three years due to a small uptick in NOPAT margin from 18.1% in 2014 to 18.4% TTM.
Figure 1: FFIV’s 10-Year Revenue and NOPAT Margin
Sources: New Constructs, LLC and company filings
Strong Free Cash Flow Generation
Robust organic growth in revenues and profits, combined with the limited need for additional capital investment, have resulted in strong free cash flow (FCF) generation. FFIV has generated cumulative free cash flow of $1.5 billion (21% of market cap) over the past five years. The firm’s $354 (TTM) of FCF is the highest on record for any 12-month period and equates to a 7% FCF yield compared to 2% for the average S&P 500 stock.
High Margins and Capital Efficiency Drive Top-Tier ROIC
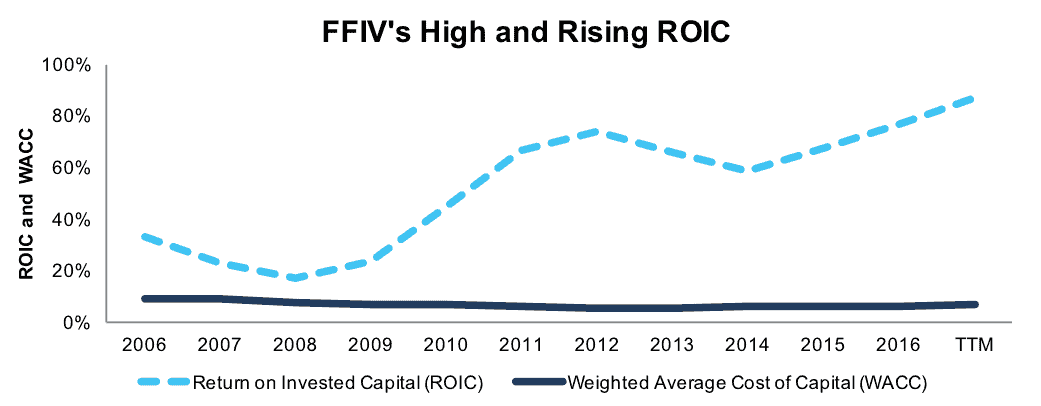
In addition to high NOPAT margins, FFIV’s balance sheet is also very efficient. FFIV’s 5.4 ratio of invested capital turns is well above average and translates an 18% NOPAT margin into an 87% return on invested capital (ROIC), which ranks in the top-quintile of our coverage universe. FFIV’s ROIC has averaged 58% over the past decade and has been trending higher over time as NOPAT continues to grow while invested capital has been little changed. FFIV had $399 of invested capital at the end of 2007 compared to $402 million currently.
Figure 2: FFIV’s 10-Year ROIC vs. WACC
Sources: New Constructs, LLC and company filings
ROIC/Valuation Regression Shows FFIV is Undervalued
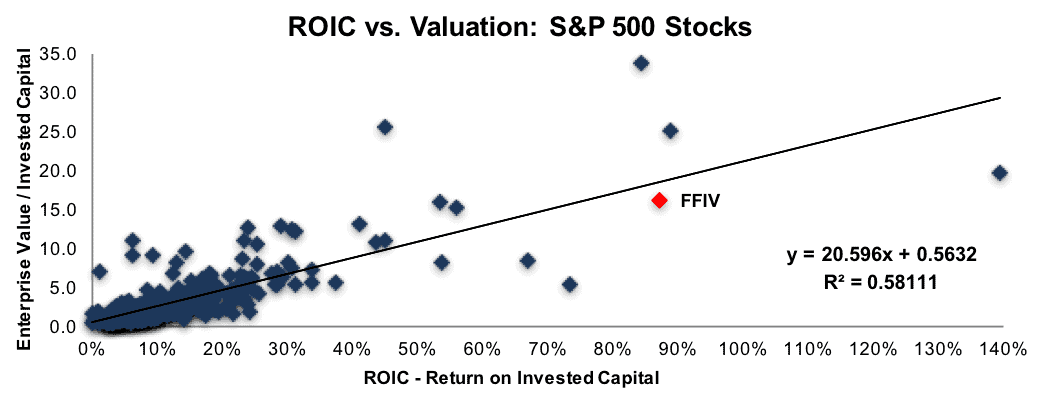
Per Figure 3, ROIC explains roughly 60% of the valuation difference among S&P 500 stocks when evaluated on an enterprise value/invested capital basis, which we prefer as a cleaner and more meaningful price-to-book ratio. Despite FFIV’s significant ROIC advantage (87% vs. 18% for the group), its stock trades at a discount as shown by FFIV’s position below the regression trend line in Figure 3. If FFIV traded at parity with S&P 500 stocks, its EV/invested capital multiple would rise from the current 16.1 to 18.5 and the stock would be $135/share – 16% above the current price.
Figure 3: Regression Analysis – ROIC vs. Valuation
Sources: New Constructs, LLC and company filings
Executive Comp Plan Could be Better, but Has Not Been Abused
We know from Figure 3 above, and numerous case studies, that return on invested capital (ROIC) is the primary driver of shareholder value creation.[1] Accordingly, we favor executive compensation plans that use ROIC to measure performance and to ensure executives’ interests are aligned with shareholders’ interests. Revenue and non-GAAP performance targets can be an incentive to sacrifice profitability for growth, or worse, engage in activities that destroy shareholder value.
FFIV’s executive compensation consists of base salary (18%), annual cash incentive comp (17%) and long-term stock incentive comp (65%). Annual cash incentives are tied to the achievement of revenue (70%) and EBITDA (30%) targets. Long-term equity incentives are awarded based on achieving similar hurdles over a four-year period. The use of revenue growth and EBITDA leave much to be desired in terms of truly aligning executive and shareholder interests.
Despite its shortcomings, FFIV’s executive compensation plan has not led to executives being paid handsomely to destroy shareholder value, as we see in many cases. FFIV’s economic earnings have increased 25% compounded annually over the past decade. FFIV has generated cumulative economic earnings of $1.5 billion over the past five years and $354 million TTM. In light of management’s execution track record, particularly the absence of dilutive acquisitions, we are inclined to look past executive compensation plan risk in this case.
High Margins and ROIC Reflect Competitive Advantages
FFIV provides critical networking equipment, security solutions and consulting services that ensure applications delivered over Internet Protocol (IP) networks are both secure and available to any user, anywhere, anytime, on any network and on any device. FFIV is a recognized market leader in this area both in the U.S. and internationally. The U.S. market accounts for roughly 50% of total revenue, while emerging markets account for 23% and the Asia-Pacific region accounts for 15%.
Per Figure 4, FFIV generates a net operating profit before tax (NOPBT) margin of 28% (TTM). This NOPBT margin is double the average NOPBT margin for the 21 peers that make up the iShares North America Tech-Multimedia Networking ETF (IGN). The gap between FFIV profit margins and peers has narrowed over the last five years. This trend has more to do with several peers turning the corner from operating losses to profits than FFIV giving up margin to compete.
Figure 4: FFIV’s Wide Margin Advantage
Peer Group Constituents: ADTN, ARRS, BRCD, CIEN, CSCO, FNSR, HRS, IDCC, INFN, JNPR, MSI, NTCT, NTGR, OCLR, PANW, PLT, SATS, UBNT, VIAV and VSAT
Sources: New Constructs, LLC and company filings
The ability to maintain such high margins, and wide margin advantage, for an extended period of time makes a strong statement about the company’s product quality, pricing power and operational efficiency. FFIV’s high margins also provide a buffer against adverse operating conditions, the capacity to invest for future growth, and the ability to navigate aggressive price competition while still maintaining an adequate ROIC.
Bears Focus on Slower Growth That’s Already Priced-In
The emergence of a slower growth profile due to increased competition is the primary focus of the bear case. FFIV’s projected revenue growth of 4% per year for FY17 and FY18 does represent a slowdown from longer-term historical growth. Further, FFIV’s recent revenue growth has been modestly below expectations, which has led to a 3% decline in consensus revenue expectations for FY17 and FY18 over the past year.
From the perspective of management, and the bulls, the current period of slower growth is a transitory function of where the company’s customer base stands in their equipment replacement and upgrade cycle. Current growth also lacks the full anticipated effect of the ongoing shift towards emphasizing service contract revenue (i.e. recurring revenue) in addition to providing equipment, which was the company’s primary focus historically.
As we outline later in the report, the potential for slower than historical growth going forward is well reflected in the current valuation and the market’s implied expectations for future profits. Further, we see little sign in FFIV’s margin trends, or the results of competitors, that the company is poised to relinquish its market position.
Replacement/Upgrade Cycle and Shift to Services Could Provide Catalysts
FFIV has brought more new products to market during late FY16 and early FY17 than at any other point in its history. The initial pace of customer adoption has proven disappointing to some investors. However, we believe this pace has far more to do with where FFIV’s customers are in their equipment replacement and upgrade cycle that it does with the quality or value proposition of FFIV’s products. We also believe that FFIV’s ongoing evolution to become more of a consulting and services provider should boost growth in coming years.
These factors put FFIV in good position to exceed the low level of market-implied expectations embedded in the stock price. This scenario could, in turn, result in Wall Street analysts revising their estimates higher, which will lead to investors revaluing the stock higher.
We are under no illusions that we can routinely identify, or time, the exact catalyst(s) that will cause a stock’s price to rise or decline. Our approach is based on assessing risk/reward trade-off, which we view as very favorable for investors in the case of FFIV. The negative sentiment around slower growth lowers the bar for future upside surprises while also lowering the valuation risk should results disappoint.
Low Expectations Embedded in the Valuation
At its current price of $116/share, FFIV has a price-to-economic book value (PEBV) ratio of 1.1. This ratio means the market expects FFIV’s NOPAT to grow no more than 10% over the remaining life of the firm. This expectation seems overly conservative for a firm with a strong market position in critical internet applications that has grown NOPAT 19% compounded annually over the past decade. Further, FFIV’s NOPAT has grown 21% cumulatively over the past three years alone.
If FFIV can maintain current NOPAT margins (18% TTM) and grow NOPAT by 5% compounded annually over the next decade, the stock is worth $153/share today – a 32% upside. In a more optimistic scenario of 7% compound annual NOPAT growth over the next decade, the stock is worth $177/share today – a 53% upside.
The first scenario assumes revenue growth in line with consensus over the next two years (4%) and then at 6% thereafter. The second scenario assumes consensus level revenue growth over the next two years and then 8% thereafter. Neither scenario assumes FFIV has to materially increase working capital or its investment in fixed assets. We note FFIV’s invested capital has grown by 0.1% compounded annually over the past decade.
Buybacks Could Provide a 4% Shareholder Yield
FFIV does not currently pay a cash dividend, although it theoretically could support a meaningful one based on its FCF generation. Management has instead elected to focus on share repurchases. The firm’s outstanding share count has been reduced by 20% over the past five years, from 79.1 million at the end of 2012 to 63.5 million today.
As of June 30, the company had repurchased 3.3 million shares at an average price of $136.34 (or $450 million) during fiscal 2017. The firm had $324 million remaining under the $1 billion repurchase authorization approved in April 2016. The shareholder yield from repurchases could approximate 4% assuming the remaining full $324 million is repurchased over the coming year.
Insider Trading and Short Interest
Insiders own just under 1% of the firm. Year-to-date insider trading activity has been on the sell side, but has totaled only 101,000 shares, or 13% of a single-day’s trading volume. While we typically prefer management have more “skin in the game,” we are willing to look past low insider ownership given the solid execution.
Current short interest is 4 million shares, or 8% of the float and 5 days to cover. Short interest is down slightly from year end and up slightly from the prior month, but there is no identifiable trend. Short interest has oscillated between 3.5 and 4.5 million shares over the past year.
Auditable Impact of Footnotes & Forensic Accounting Adjustments
Our Robo-Analyst technology enables us to perform forensic accounting with scale and provide the research needed to fulfill fiduciary duties. In order to derive the true recurring cash flows, an accurate invested capital, and an accurate shareholder value, we made the following adjustments to F5 Networks’ 2016 10-K:
Income Statement: we made $28 million of adjustments with a net effect of removing $2 million in non-operating expense (<1% of revenue). We removed $15 million related to non-operating expenses and $13 million related to non-operating income. See all adjustments made to FFIV’s income statement here.
Balance Sheet: we made $1.3 billion of adjustments to calculate invested capital with a net decrease of $1.2 billion. The most notable adjustment was $114 million (8% of reported net assets) related to off-balance sheet operating leases. See all adjustments to FFIV’s balance sheet here.
Valuation: we made $1.3 billion of adjustments with a net effect of increasing shareholder value by $1.2 billion. Aside from $1.2 billion of excess cash, the largest adjustment to shareholder value was $114 million of off-balance sheet operating leases. This adjustment represents 2% of FFIV’s market value.
Attractive Funds That Hold FFIV
The following funds receive our Attractive-or-better rating and allocate significantly to FFIV.
- Fidelity Advisor Communications Equipment Fund (FDMAX) – 5% allocation and an Attractive rating
- Trillium Small/Mid Cap Fund (TSMDX) – 2% allocation and an Attractive rating
- BMO Mid-Cap Growth Fund (BGMAX) – 2% allocation and an Attractive rating
This article originally published on October 18, 2017.
Disclosure: David Trainer, Kenneth James, and Kyle Guske II receive no compensation to write about any specific stock, style, or theme.
Follow us on Twitter, Facebook, LinkedIn, and StockTwits for real-time alerts on all our research.
[1] Ernst & Young’s recent white paper, “Getting ROIC Right”, proves the superiority of our research and analytics.
Click here to download a PDF of this report.
Photo Credit: SparkFun Electronics (Flickr)


