
As many of you may know, the live-traded Bloomberg index based on our Very Attractive-rates stocks, the Bloomberg New Constructs Ratings VA-1 Index (ticker: BNCVA1T:IND) strongly outperformed the S&P 500 by 9.2% in 1Q25, rising 4.6% compared to the S&P 500 falling 4.6%.
This outperformance is strong evidence that the proprietary fundamental data that drives our Stock Ratings delivers novel alpha.
Our ETFs and mutual funds Ratings are based on our Stock Ratings. After all, a fund is only as good as the stocks it holds, so it makes sense that to properly evaluate a fund, one must evaluate each of the fund’s holdings. It also makes sense that if Very Attractive Rated Stocks as a group can outperform, then so should the Very Attractive-rated mutual funds.
After rigorous analysis of our database of 7,600+ ETFs and mutual funds, we found a mutual fund that earns our Very Attractive Predictive Fund Rating. It earns this rating because it picks stocks with quality Risk/Reward and charges below-average fees. American Century Disciplined Core Value Fund (BIGRX) is this week’s Long Idea.
This Long Idea coincides with our quarterly updates on the Best & Worst Sector & Style ETFs and mutual funds. These reports feature the best ETFs and mutual funds in each of the 11 Sectors and 12 Investment Styles.
Forward-Looking Research Reveals a Very Attractive Fund
While Morningstar gives BIGRX a 2-Star (backward-looking) rating, our analysis of its holdings reveals the fund allocates more to good stocks, i.e. profitable companies with undervalued stock prices, than its benchmark, iShares Core S&P U.S. Value ETF (IUSV). See Figure 1.
We leverage our Robo-Analyst technology[1] to assess a mutual fund’s portfolio quality by analyzing the fund’s individual stock holdings.
Through this rigorous analysis, we find that BIGRX allocates 36% of its assets to Attractive-or-better rated stocks compared to just 15% for IUSV. On the flip side, BIGRX allocates just 19% of its assets to Unattractive-or-worse rated stocks compared to 33% for IUSV.
Figure 1: BIGRX Holdings Vs. IUSV Holdings
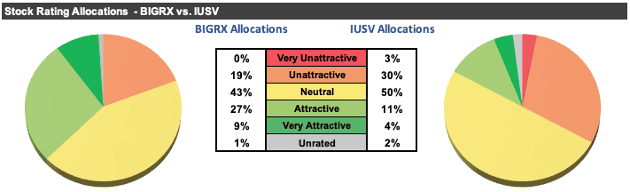
Sources: New Constructs, LLC, company, ETF, and mutual fund filings
Per Figure 2, our holdings analysis also reveals BIGRX’s portfolio is of much higher quality than the S&P 500 as represented by State Street SPDR S&P 500 ETF Trust (SPY). SPY earns our Attractive rating, but only 10% of SPY’s portfolio is allocated to stocks rated Attractive-or-better and 31% is allocated to stocks rated Unattractive-or-worse.
Figure 2: BIGRX Holdings Vs. SPY Holdings
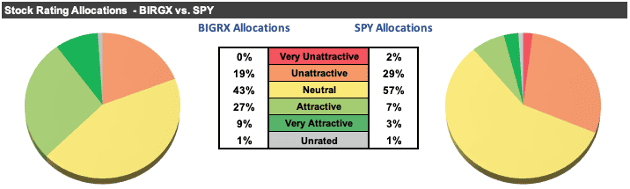
Sources: New Constructs, LLC, company, ETF, and mutual fund filings
The Fund’s Strategy Finds Companies with Quality Risk/Reward
BIGRX’s investment strategy, led by American Century Investments, aims to create a portfolio of primarily large cap U.S. stocks with a focus on long-term capital growth, that also provides a dividend yield greater than that of the S&P 500. Managers use quantitative and qualitative management techniques in a multi-step process, based on objective measures which include:
- valuation (ratios which look at a firm’s value relative to cash flow),
- quality (profitability and earnings sustainability),
- growth (rate of growth of a company’s earnings), and
- and sentiment (historical stock returns, share volume, and options data).
Based on the output of the quantitative model, managers then consider factors such as economic events, corporate announcements, risk management, transaction costs, and liquidity to select stocks.
BIGRX’s managers’ belief in the importance of sustainable earnings and valuation relative to cash flows would appear to resemble two key drivers of our Stock Ratings, quality of earnings and valuation. Without detailed information regarding which specific metrics American Century Investments uses for its stock-picking criteria, we can only judge the effectiveness of their stated strategy by analyzing the holdings of the mutual fund.
In doing so, it’s clear the fund allocates to companies with quality overall Risk/Reward.
Given the fund’s superior asset allocation (compared to its benchmark and the SPY), we think the managers successfully implement their philosophy of finding stocks that “provide a balance between risk and return”, as we’ll detail in our holdings analysis below.
Quality Stocks Drive Very Attractive Risk/Reward Rating
Figure 3 shows our detailed rating for BIGRX, which includes each of the criteria we use to rate all mutual funds under coverage. These criteria are the same for our Stock Rating Methodology, because the performance of a mutual fund’s holdings drives the performance of the mutual fund after fees. Figure 3 also compares BIGRX’s rating with those of IUSV, SPY and IWM.
Figure 3: American Century Disciplined Core Value Fund Breakdown
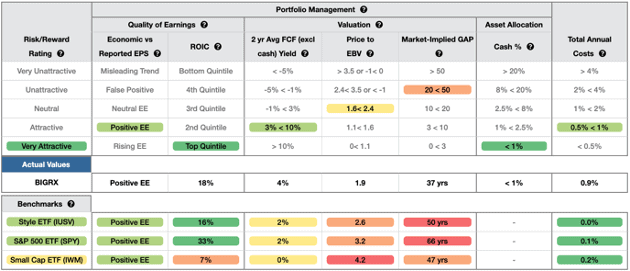
Sources: New Constructs, LLC and company filings
BIGRX’s holdings are superior or equal to IUSV in all five and superior or equal to SPY in four out five of the criteria that make up our Portfolio Management rating. Specifically:
- BIGRX’s holdings generate positive economic earnings, same as IUSV and SPY.
- BIGRX’s ROIC is 18% and higher than the 16% earned by IUSV’s holdings, but lower than the 33% earned by SPY’s holdings.
- BIGRX’s free cash flow (FCF) yield of 4% is higher than IUSV and SPY’s at 2%.
- The price-to-economic book value (PEBV) ratio for BIGRX’s holdings is 1.9, which is much lower than IUSV’s at 2.6 and SPY’s at 3.2.
- Our discounted cash flow analysis reveals an average market-implied growth appreciation period (GAP) of just 37 years for BIGRX’s holdings compared to 50 years for IUSV and 66 years for SPY.
Market expectations for stocks held by BIGRX imply profits will grow much less than the stock’s held by IUSV (measured by PEBV ratio and the market-implied GAP).
In other words, BIGRX’s profitability is higher (measured by ROIC), yet the stocks held by BIGRX are significantly cheaper (as measured by PEBV and the market-implied GAP).
A Closer Look at Holdings Reveals More Positives
Of the 199 BIGRX’s holdings in our coverage universe, 6 are also open Long Ideas of ours. These 6 stocks make up nearly 8% of BIGRX’s portfolio.
Also, of the 199 holdings under coverage:
- 98% have a positive ROIC,
- 85% have a positive 2-year average free cash flow yield,
- 60% have a positive PEBV ratio of 1.9 or less, and
- 62% have a GAP of 37 years or less.
Quality Stock Selection at Below Average Cost
BIGRX’s 0.87% total annual costs (TAC) are below the 1.50% simple average and 0.98% asset-weighted average of the 910 other All Cap Value mutual funds under coverage. Figure 4 shows our breakdown of BIGRX’s total annual costs, which is available for all 7,600+ mutual funds and ETFs under coverage.
Figure 4: BIGRX’s Total Annual Costs Breakdown
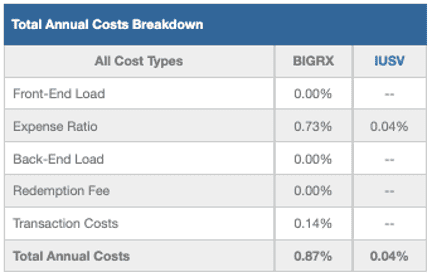
Sources: New Constructs, LLC and company filings
The Importance of Holdings Based Fund Analysis
We offer clients in-depth reports for all the 7,600+ ETFs and mutual funds under coverage. Click below for a free copy of our standard mutual fund report on BIGRX.
Smart fund (or ETF) investing means analyzing each of the holdings of a fund. Simply buying an ETF or mutual fund based on past performance does not necessarily lead to outperformance. Only thorough holdings-based research can help determine if a fund’s methodology leads managers to pick high-quality or low-quality stocks.
Most investors don’t realize they can access superior fundamental research that enables them to overcome inaccuracies, omissions, and biases in legacy fundamental research and data. Our Robo-Analyst technology analyzes the holdings of all 1,084 ETFs and mutual funds in the All Cap Value style and ~7,600+ ETFs and mutual funds under coverage to avoid “the danger within”.
Build A Better Fund: Use our DIY ETF Tool
As we show in The Paradigm Shift to DIY ETFs, new technologies enable investors to create their own fund without any fees while also enabling better, more sophisticated weighting methodologies. For example, if we reallocate the fund’s capital to the companies with the best ROICs, our customized fund allocates:
- 45% of assets to Attractive-or-better rated stocks (compared to 36% for BIGRX)
- 11% of assets to Unattractive-or-worse rated stocks (compared to 19% for BIGRX)
Compare the quality of stock allocation in as-is BIGRX vs. our customed version of BIGRX in Figure 5.
Figure 5: BIGRX Vs. Custom Fund Allocations
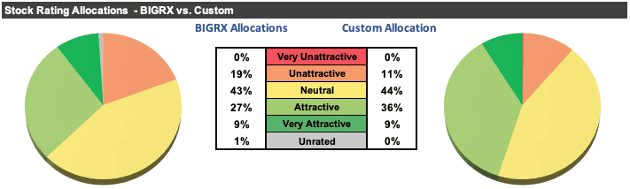
Sources: New Constructs, LLC and company filings
Note that our DIY ETF tool allows clients to pick and weight portfolio holdings based on multiple proprietary metrics, such as Core Earnings, Economic Earnings, Free Cash Flow, Net Operating Profit After Tax and more.
Check Out Indices Based on New Constructs Research
While we’re talking about creating your own fund, we should highlight the indices we’ve developed with Bloomberg’s Index Licensing Group.
We have multiple indices in production now. You can get more details on them here.
- Bloomberg New Constructs 500 Index (ticker: B500NCT:IND)
- Bloomberg New Constructs Ratings VA-1 Index (ticker: BNCVA1T:IND).
Figure 6 compares the performance of the Very Attractive Stocks Index, managed by Bloomberg, to the S&P 500. In 1Q25, the Bloomberg New Constructs Ratings VA-1Index (ticker: BNCVAT1T:IND) was up 4.6% while the S&P 500 was down 4.6%.
Figure 6: Very Attractive-Rated Stocks Strongly Outperform the S&P 500 In 1Q25
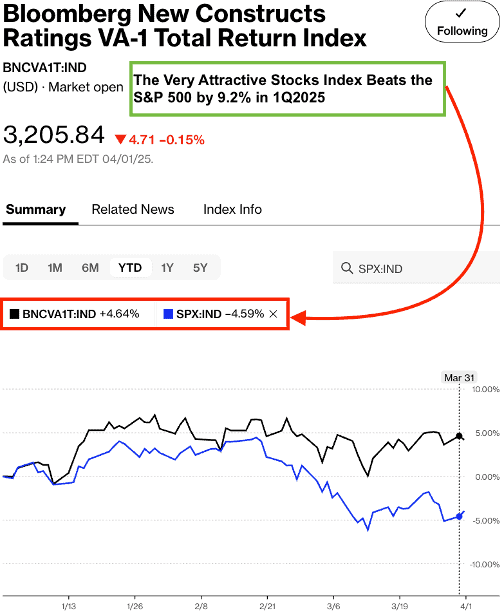
Sources: Bloomberg
Note: Past performance is no guarantee of future results.
Figure 7 compares the performance of the Bloomberg New Constructs 500 Total Return Index, managed by Bloomberg, to the S&P 500. In 1Q25, the Bloomberg New Constructs 500 Total Return Index (ticker: BNCVAT1T:IND) was down 3.6% while the S&P 500 was down 4.6%.
Figure 7: Bloomberg New Constructs 500 Index Strongly Outperforms the S&P 500 in 1Q25
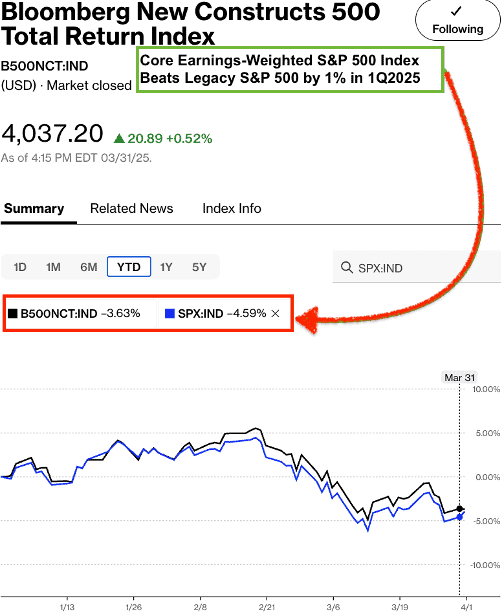
Sources: Bloomberg
Note: Past performance is no guarantee of future results.
This article was originally published on April 16, 2025.
Disclosure: David Trainer, Kyle Guske II, and Hakan Salt receive no compensation to write about any specific stock, style, or theme.
Questions on this report or others? Join our online community and connect with us directly.
[1] Our Robo-Analyst technology provides superior fundamental data, as proven in The Journal of Financial Economics, and a novel source of alpha.