Our research has been cautious on small cap funds for some time. All three small cap style categories (value, growth and blend) received a Dangerous rating in our 2Q17 Style Rankings for ETFs and Mutual Funds report. Despite the apparent scarcity of appealing options, adopting a zero allocation to small cap equities is a potentially imprudent investment decision for those with longer time horizons or higher risk tolerances.
Our Robo-Analyst technology helps investors navigate this crowded and high-risk fund space by sifting through the holdings of all 1,492 small cap style ETFs and mutual funds, 65% of which are rated Dangerous or worse. In the process, we identified a particularly attractive fund that traditional, backward-looking fund research overlooks.
Royce Small Cap Value (RVFIX, RYVFX, RVFCX, RVVHX, RVVRX, RVFKX) was our second-ranked small cap value fund for 2Q17 and appears poised to stay atop the rankings based on holdings quality. All share classes of the fund receive an Attractive or Very Attractive rating. The fund is also this week’s Long Idea.
Holdings Quality Analysis Reveals Favorable Allocations
The only justification for a mutual fund to charge higher fees than its ETF benchmark is “active” management that leads to out-performance. A fund is most likely to outperform if it has higher quality holdings than its benchmark. To make this determination on holdings quality, we leverage our Robo-Analyst technology to drill down to the individual stock level of every fund. This capability empowers our unique holdings based ETF and mutual fund rating methodology.
Figure 1: Royce Small Cap Value Fund (RVFIX) Asset Allocation
Sources: New Constructs, LLC and company filings
Per Figure 1, Royce Small Cap Value allocates 36% of its assets to Attractive-or-better rated stocks compared to just 14% for the benchmark iShares Russell 2000 Value ETF (IWN). Further, exposure to Dangerous-or-worse rated stocks is much lower for Royce Small Cap Value (9% of assets) than for IWN (36 of assets).
The fund’s top 10 holdings comprise 25% of assets and are 90% Neutral-or-better rated. Six of the top-10 stocks receive an Attractive-or-better rating and two are on June’s Most Attractive Stocks Model Portfolio. Only one stock in the top-10, or 3% of assets, receives a Dangerous-or-worse rating.
Given this favorable combination of Attractive vs. Dangerous allocations relative to the benchmark, Royce Small Cap Value appears well positioned to capture upside potential while minimizing downside risk. Compared to the average mutual fund, Royce Small Cap Value has a much better chance of generating the outperformance required to justify its fees.
Royce Finds the “Value” in the Small Cap Stocks
True value investing still works despite the proliferation of passive strategies. While many funds are labeled “value” despite allocating to some of the most expensive stocks, we see an exception in Royce Small Cap Value. The fund’s manager does a good job allocating capital to higher-quality companies with lower relative valuations, the cornerstone of the value investing discipline. This observation is based on our analysis of the fund at the stock level, where we analyze earnings quality, true profitability and the market-implied cash flow expectations embedded in stock prices.
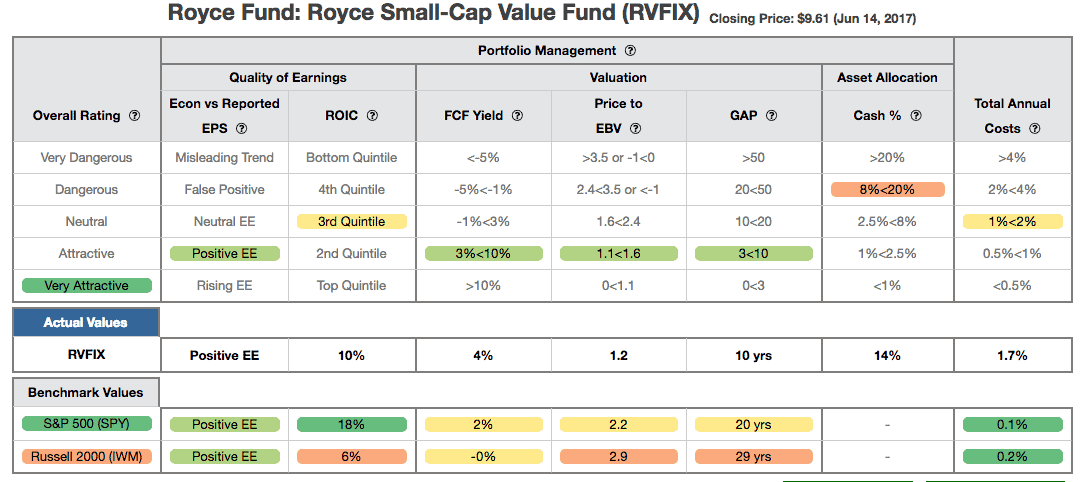
Figure 2 contains our detailed fund rating for Royce Small Cap Value (RVFIX), which includes each of the criteria we use to rate all funds under coverage. These criteria are very similar to our Stock Rating Methodology, because the performance of a fund’s holdings equals the performance of a fund. The results of this analysis reveal important information for investors in Royce Small Cap Value Fund.
Figure 2: Royce Small Cap Value Fund (RVFIX) Rating Breakdown

The return on invested capital (ROIC) for RVFIX’s holdings is 10%, well above the 6% ROIC earned by Russell 2000 companies. Further, the 4% free cash flow (FCF) yield of RVFIX’s holdings is also superior to the Russell 2000 (0%) and even the S&P 500 (2%).
The price to economic book value (PEBV) ratio for the Russell 2000 is 2.8, while the PEBV ratio for RVFIX is only 1.2. This ratio means the market expects Russell 2000 profits to nearly triple from current levels while the profits of the companies held by RYVFX are expected to grow by only 20% from current levels.
Lastly, our discounted cash flow analysis of fund holdings reveals a market implied growth appreciation period (GAP) of nine years for RVFIX compared to 29 years for the Russell 2000. In other words, Russell 2000 companies have to grow economic earnings three times as long as companies held by RVFIX to justify their current stock prices.
Royce Small Cap Value Has Earned Its Fees Over Time
With total annual costs (TAC) of 1.70%, RVFIX expenses are lower than 55% of Small Cap style mutual funds under coverage. Coupled with its quality holdings, below average fees make RVFIX (and other share classes of the fund) more attractive. More details can be seen in Figure 3, which includes the five additional classes of the fund. For comparison, the average TAC of all Small Cap style mutual funds under coverage is 2.13%, the weighted average is 1.38%, and the benchmark (IWN) has total annual costs of 0.28%.
Royce Small Cap Value’s TAC is 0.50 percentage points higher than its stated expense ratio. While not perfect, Royce Small Cap Value Fund’s expense ratio does an acceptable job of representing the true costs of investing in the fund. In depth analysis of RVFIX’s TAC is on page 2 here.
Figure 3: Royce Special Equity Fund’s Cost Comparison
Sources: New Constructs, LLC and company filings
To justify its active management fees, the Royce Small Cap Value Fund must outperform its benchmark (IWN) by the following over three years:
- RVFIX must outperform by an average of 1.42% annually.
- RVVHX must outperform by an average of 1.60% annually.
- RYVFX must outperform by an average of 1.89% annually.
- RVVRX must outperform by an average of 2.30% annually.
- RVVKX must outperform by an average of 2.41% annually.
- RVFCX must outperform by an average of 2.79% annually.
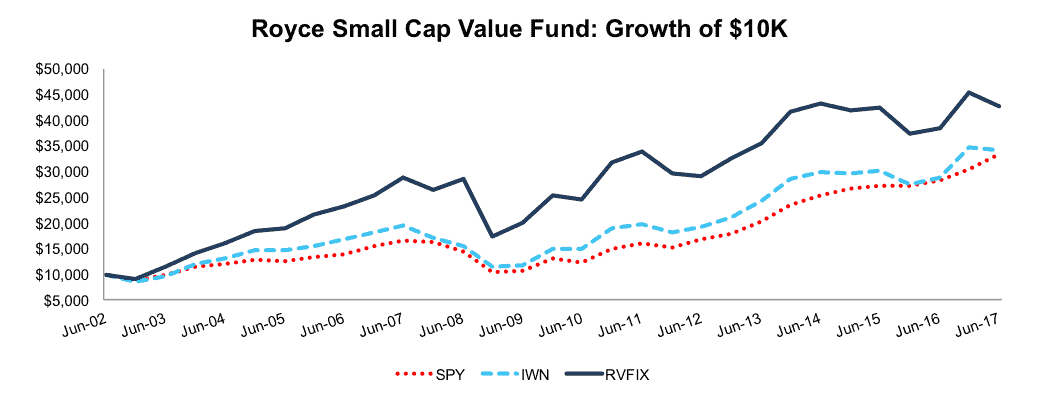
While we fully recognize that past performance is no guarantee of future results, Royce Small Cap Value Fund’s security selection has clearly led to outperformance over the long term. Further, the amount of outperformance required by the fund’s active management fees (for investors to get their money’s worth) is a reasonable hurdle that has been surpassed by the fund since inception. Based on the 15-year cumulative returns reflected in Figure 4, Royce Small Cap Value Fund has beaten its benchmarks by an average of 6% annually.
Figure 4: Royce Small Cap Value Fund vs. IWN & SPY
Sources: New Constructs, LLC and company filings.
Royce Small Cap Value Fund’s more recent performance has been less favorable, with the fund down 5% year-to-date and lagging the IWN, which is down 2%. However, the solid underlying fundamentals and attractive valuations of the fund’s holdings provide an excellent opportunity for a return to outperformance going forward.
The Importance of Holdings Based Fund Analysis
The analysis above shows that investors do have options when they are looking to invest in Small Cap stocks. Royce Small Cap Value Fund is among a limited group of actively managed funds that has justified its fees over time through high quality asset allocation, the only reason to pay fees above the ETF benchmark.
Each quarter we rank the 10 sectors in our Sector Ratings for ETF & Mutual Funds and the 12 investment styles in our Style Ratings For ETFs & Mutual Funds report. This analysis allows us to find funds that investors using traditional fund research may overlook, such as Royce Small Cap Value Fund.
This article originally published on June 19, 2017.
Disclosure: David Trainer, Kyle Guske II, and Kenneth James receive no compensation to write about any specific stock, sector, style, or theme.
Click here to download a PDF of this report.
Photo Credit: InvestmentZen


