
After withdrawing its IPO the day before it was expected to trade in September 2019, Endeavor Group Holdings (EDR: $23.50/share midpoint of IPO price range), a talent agency turned entertainment and sports provider, is planning to IPO on April 29, 2021. At the midpoint of its price range ($23.50/share), Endeavor is valued at ~$10 billion and earns our Unattractive rating.
While going public in today’s reckless meme stock-driven investing environment is good for the company’s insiders, it’s not good for investors. Endeavor needs this IPO more than investors do.
Endeavor will test investors’ appetite for overvalued and over-hyped IPOs. No matter how many Elon Musks it adds to its board, Endeavor’s expected valuation of $10 billion is in nosebleed territory.
A $10 billion valuation is too high because it implies the company will achieve revenues greater than Fox Corp (FOXA) and Live Nation (LYV). Meanwhile, at its 2020 cash burn rate (-$1.5 billion), Endeavor only has enough cash to survive another 8 months.
Our IPO research aims to provide investors with more reliable fundamental research.
Revenue Growth With No Profits
Endeavor owns an impressive list of sports properties and events, such as UFC, Professional Bull Riders (PBR), the Miami Open, Frieze Art Fair, New York Fashion Week, and more. The firm also sells sports video programing on behalf of clients including the International Olympic Committee, the NFL, and NHL. Lastly, the firm operates WME and IMG talent agencies, representing actors, directors, athletes, models, and more.
Prior to COVID, 43% of Endeavor’s revenue came from events, experiences, and rights, 36% from talent representation, and 20% from owned sports properties (such as UFC) in 2019. Due to COVID, Endeavor’s 2020 revenue breakdown is more heavily weighted towards owned sports properties.
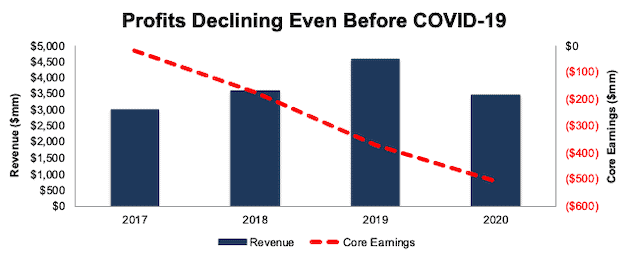
Despite significant revenue growth prior to COVID-19, Endeavor has been unable to turn a profit. From 2017-2019, revenue grew 23% compounded annually. However, Core Earnings[1] fell from -$19 million to -$371 million over the same time. Core Earnings fell further, to -$508 million, in 2020. In 2020, Endeavor burned $1.3 billion in free cash flow (FCF). Over the past three years, Endeavor Group burned $2.3 billion in FCF.
Figure 1: Endeavor’s Revenue & Core Earnings: 2017-2020
Sources: New Constructs, LLC and company filings
Acquisition Strategy Is Bad For Profits
In its S-1, Endeavor Group notes it has a “disciplined merger and acquisition strategy” and has completed more than 20 mergers and acquisitions since 2014. While the acquisitions of IMG and The UFC helped grow revenue and assets, they have not generated any profits or created shareholder value.
Endeavor’s invested capital has grown by 8% compounded annually since 2017 while net operating profit after-tax (NOPAT) has fallen from $139 million to -$550 million over the same time.
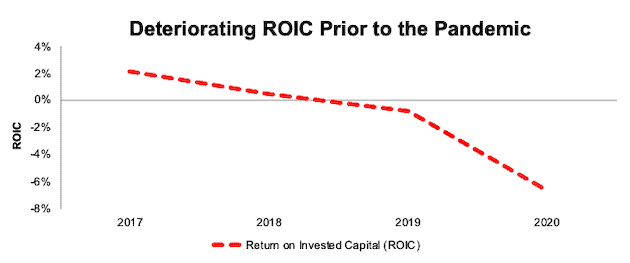
A ballooning balance sheet combined with falling profits led Endeavor’s return on invested capital (ROIC) down from 2% in 2017 to -7% in 2020, per Figure 2. Even before COVID-19, Endeavor’s ROIC was -1% in 2019.
Figure 2: Endeavor’s ROIC: 2017-2020
Sources: New Constructs, LLC and company filings
Putting On Those Acquired Events is Costly
While owning rights to well-known events in sports and culture provides opportunity to bring in viewer/attendees, it’s also very costly. Despite efforts to rein in costs in the light of COVID-19, Endeavor’s direct operating costs (which include expenses associated with the production of events and experiences, content production costs, operation of training facilities, and fees for media rights) and selling, general & administrative costs are a larger percent of revenue in 2020 than in 2018.
From 2018 to 2020, direct operating costs increased from 48% of revenue to 50% and SG&A from 45% to 52%. Combined, these costs make up 102% of revenue in 2020.
Positioned in Valuable End Markets…
While running events is costly and unprofitable so far, selling its live events rights and assisting clients in selling rights to other live events positions Endeavor in one of the fasting growing markets in the entertainment industry: live sports content. And, as noted in its S-1, Endeavor expects its target markets to experience healthy growth:
- 5% compound annual growth rate (CAGR) through 2024: global sporting events, concerts, and performing arts ticket market
- 8% CAGR through 2023: global sports media rights spend
- 12% CAGR through 2024: global sports gaming industry
- 7% CAGR through 2023: global film and television content (not live).
The problem: 14% revenue CAGR through 2030: what Endeavor has to achieve to justify a $10 billion valuation.
… but Priced to Be Bigger Than Fox Corp, Live Nation, and Interpublic Group
When we use our reverse discounted cash flow (DCF) model to analyze the future cash flow expectations baked into EDR, we find that shares are priced for growth in revenue that greatly outpaces the industry. Accordingly, risk/reward at the IPO price is unattractive.
In order to justify the midpoint of its IPO price range ($23.50/share), Endeavor must:
- achieve an 8% NOPAT margin (above Live Nation’s 2019 NOPAT margin (3%) but below Disney’s [DIS] 2019 NOPAT margin of 15%). For reference, Endeavor’s 2019 NOPAT margin is -1% and its 2020 NOPAT margin is -16%
- grow revenue by 14% compounded annually for the next decade (well above the expected growth rates in Endeavor’s end markets)
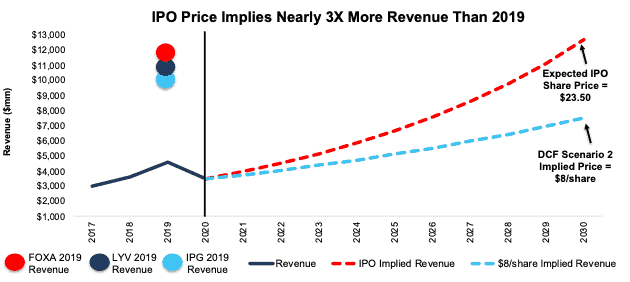
In this scenario, Endeavor would generate nearly $13 billion revenue in 2030, which is just under 3x its record revenue achieved in 2019 and greater than the 2019[2] revenue of content production and sports distribution network Fox Corp (FOXA), event and ticket platform Live Nation, and global marketing agency Interpublic Group (IPG).
Figure 3 compares the firm’s implied future revenue in this scenario to its historical revenue, along with the revenue of the currently much larger peers noted above. We also include the implied revenue in a more realistic scenario, which is detailed below.
Figure 3: Midpoint IPO Valuation Is Too High
Sources: New Constructs, LLC and company filings
DCF Scenario 2: Growth Is More In-Line with the Industry
We review an additional DCF scenario to highlight the downside risk should Endeavor’s revenue growth fall more in-line with industry expectations.
If we assume Endeavor:
- achieves a NOPAT margin of 8% and
- grows revenue by 8% compounded annually for the next decade, then
EDR is worth just $8/share today – a 66% downside to the midpoint of the IPO price range. See the math behind this reverse DCF scenario.
Each of the above scenarios assumes Endeavor’s YoY change in invested capital is 8% of revenue in each year of our DCF model, which could prove conservative if Endeavor continues acquiring events, brands, and agencies. For context, Endeavor’s YoY change in invested capital as a % of revenue was 28% in both 2018 and 2020, but -6% in 2019.
More Red Flags
With a lofty valuation that implies significant improvement in both revenue and profits, investors should be aware that Endeavor’s S-1 also includes these other red flags.
Public Shareholders Have No Rights: A risk of investing in Endeavor’s IPO, and many recent IPOs, is the fact that that the shares sold provide little to no say over corporate governance.
Endeavor is going public with five separate share classes, each with different voting rights. Investors in the IPO will get Class A shares and hold just 0.4-0.5% of voting rights depending upon the underwriters’ decision to exercise their option to purchase additional shares.
Given the higher voting rights of Class Y shares, CEO Ari Emanual, Chairman Patrick Whitesell, and Silver Lake Partners will control 89% of voting rights after the IPO.
This IPO takes investors’ money while giving them almost no voting power or control of corporate governance.
Past Financials Haven’t Been Reliable: Investors should take precaution when analyzing Endeavor’s numbers because in 2019 the firm’s management identified a material weakness in internal controls over financial reporting. Specifically, the firm disclosed that the weakness in internal control resulted from:
- “not having a sufficiently documented risk assessment process to identify and analyze risks of misstatement due to error and/or fraud, and not having sufficiently documented compliance communication and investigation policies.”
The SEC does not require Endeavor to have an independent auditor provide an opinion on internal controls until its second annual filing following its IPO, so we’re glad the firm chose to disclose this information. Endeavor also notes that they have fully remediated the material weakness. However, the firm still discloses:
- “in the future, it is possible that additional material weaknesses or significant deficiencies may be identified that we may be unable to remedy before the requisite deadline for those reports.”
In other words, the risk the firm’s financials are misleading, while lower than in 2019, is still material and investors should be aware.
Non-GAAP EBITDA Misleads: Long a favorite of unprofitable companies, Endeavor Group’s chosen non-GAAP metric, adjusted EBITDA, shows a much rosier picture of the firm’s operations than GAAP net income or our Core Earnings. Adjusted EBITDA gives management significant leeway in how it presents results. For example, Endeavor’s adjusted EBITDA calculation removes stock-based compensation expense, merger & acquisition costs, legal costs, and more.
More alarming, Endeavor uses adjusted EBITDA and margin “as the primary bases to evaluate our consolidated operating performance”. In 2020, Endeavor removed $1.2 billion in expenses, including $311 million in depreciation and amortization, $285 million in interest expense, and $91 million in equity-based compensation expense.
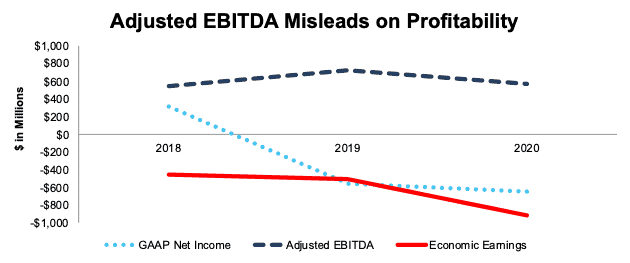
After removing all items, Endeavor reports adjusted EBITDA of $573 million in 2020. Meanwhile, GAAP net income is -$625 million and economic earnings, the true cash flows of the business, are even lower at -$916 million. Figure 4 shows the misleading nature of Endeavor’s adjusted EBITDA.
Figure 4: Endeavor’s Adjusted EBITDA vs. GAAP Net Income & Economic Earnings: 2018-2020
Sources: New Constructs, LLC and company filings
Critical Details Found in Financial Filings by Our Robo-Analyst Technology
Fact: we provide superior fundamental data and earnings models – unrivaled in the world.
Proof: Core Earnings: New Data and Evidence, forthcoming in The Journal of Financial Economics.
Below are specifics on the adjustments we make based on Robo-Analyst findings in Endeavor Group’s S-1:
Income Statement: we made $1.1 billion of adjustments, with a net effect of removing $93 million in non-operating expenses (3% of revenue). You can see all the adjustments made to Endeavor’s income statement here.
Balance Sheet: we made $1.1 billion of adjustments to calculate invested capital with a net increase of $487 million. The most notable adjustment was $375 million in asset write-downs. This adjustment represented 5% of reported net assets. You can see all the adjustments made to Endeavor’s balance sheet here.
Valuation: we made $7.2 billion of adjustments with a net effect of decreasing shareholder value by $6.7 billion. Apart from $6 billion in total debt, the largest adjustment to shareholder value was $854 million in minority interests. This adjustment represents 9% of the midpoint of Endeavor’s IPO price range. See all adjustments to Endeavor’s valuation here.
This article originally published on April 28, 2021.
Disclosure: David Trainer, Kyle Guske II, and Matt Shuler receive no compensation to write about any specific stock, style, or theme.
Follow us on Twitter, Facebook, LinkedIn, and StockTwits for real-time alerts on all our research.
[1] Only Core Earnings enable investors to overcome the errors, omissions and biases in legacy fundamental research, as proven in Core Earnings: New Data & Evidence, forthcoming in The Journal of Financial Economics.
[2] We use pre-COVID 2019 revenue for comparisons because 2020 results were distorted by COVID.