
A difficult economic environment and choppy markets are forcing investors to take a closer look at the fundamentals of stocks they own. As we warned at the beginning of the year, stocks of businesses that produce lower returns on invested capital (ROIC) will continue to underperform the wider market.
This report focuses on Carvana (CVNA: $90/share), which is back in the Danger Zone this week. We focus on GameStop (GME: $150/share) in a separate report here.
Risk-Off Leaves Weak Firms Exposed
As markets take a risk-off approach, easy money dries up, and the global economy faces continued headwinds from inflation, supply chain disruption, and labor shortages, investors need to re-evaluate their portfolios.
In this environment, strong top-line growth doesn’t satisfy markets. Instead, investors should focus on more reliable fundamental metrics: Core Earnings and ROIC. Stocks for companies with poor fundamentals suffer more in this market because, too often, their valuations are built on overhyped future profit growth hopes. When the growth stories and hype reach an end, these stocks fall fast and far. Just look at Netflix (NFLX).
Trust the Track Record
76% of our open Danger Zone picks and IPO warnings have fallen more than the S&P 500 YTD (as of closing prices on April 22, 2022). 85% of these picks have negative year-to-date (YTD) returns. Figure 1 shows the YTD performance of our open Danger Zone picks and IPO warnings. On average, our Danger Zone picks have fallen 26% YTD compared to a 10% decline in the S&P 500.
Figure 1: Danger Zone Picks Outperform as Shorts in Turbulent Markets

Sources: New Constructs, LLC and company filings.
Negative returns indicate a decline in stock price, and therefore, a winning short pick.
Most Danger Zone picks are particularly dangerous to own, even after precipitous falls in 2022, because of:
- negative and/or falling Core Earnings
- low and/or negative ROICs
- negative free cash flow (FCF)
- valuations that imply unrealistic growth in future cash flows
Below we highlight the high level of risk in owning Carvana.
Carvana Outperformed as Short by 84%, Could Fall 68% More
We put Carvana (CVNA) in the Danger Zone in August 2020, and the stock has outperformed the S&P 500 as a short by 84% since then. Even after falling 76% from its 52-week high, 64% YTD, and 39% from our report in February 2022, we think the stock has much more downside.
Growth Story Unwinding
Even after falling 64% YTD, Carvana could slide further if macro headwinds continue to undermine profit growth.
Key issues impacting Carvana’s ability to grow profits include:
- inflation undermining affordability of used cars, based on
- crazy-high used car prices
- much higher borrowing costs from rising interest rates
- rising gas prices, which could push consumers into smaller, and generally less expensive vehicles
These issues are already having an impact on Carvana’s business. Revenue growth in 1Q22, while impressive at 55% YoY, is down from nearly 200% in 2Q21, 105% in 4Q21, and the slowest YoY growth rate in the past six quarters. Figure 2 shows that, outside of the bump at the end of 2020 and into 2021, Carvana’s revenue growth rates have been steadily declining.
Figure 2: Carvana’s YoY Revenue Growth Rates Since 1Q18
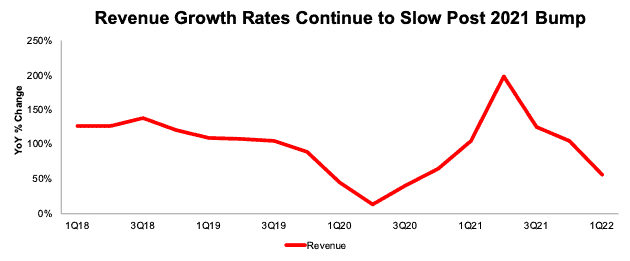
Sources: New Constructs, LLC and company filings.
Additionally, retail unit sales, at 105,185 were up 14% from 1Q21, but fell quarter-over-quarter (QoQ) for the first time in the company’s history (data reported since 1Q14).
Market Has No More Patience for Delayed Profits
Carvana noted in its 1Q22 Shareholder Letter that company goals for EBITDA and gross profit per unit, which were previously outlined in 4Q21, have been “pushed back a few quarters”. Additionally, management is no longer providing “specific numeric near-term guidance for the remainder of the year.” No news is bad news for stocks that lose money as investors have lost patience with money-losing businesses.
TAM Is Already Maxed Out
How much additional growth can Carvana achieve by opening new locations? At the end of 2021, Carvana already operated in 311 markets and served 81% of the U.S. population. Given the macro headwinds, it will be increasingly difficult to maintain rapid growth rates while already having saturated most of the U.S. market.
Significant Cash Burn Even in the Best of Times
Despite record used car prices and significant demand in 2021, Carvana has failed to generate positive free cash flow in any year since going public (data back to 2016). Since 2016, Carvana has burned through $7.4 billion in FCF. See Figure 3. Heavy cash burn is likely to continue, given the headwinds outlined above. If Carvana couldn’t generate positive cash flow in the best of times, how will it ever?
Management is diluting investors to keep the cash burn going. After its earnings report, Carvana announced it plans to sell up to $1 billion in common stock, $1 billion in series A perpetual preferred stock, and $2.3 billion in senior unsecured notes due in 2030. These issuances will only further dilute existing shareholders, while doing nothing to improve the economics of the business.
Figure 3: Carvana’s Cumulative Free Cash Flow Since 2016
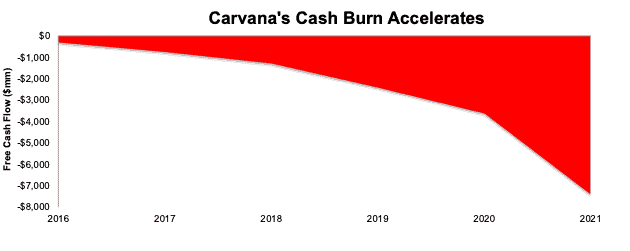
Sources: New Constructs, LLC and company filings.
Lack of Profitability Makes Competing More Difficult
Carvana’s operations and goals to take market share are further hampered by the firm’s lagging profitability. Per Figure 4, Carvana has the second-lowest net operating profit after-tax (NOPAT) margins amongst its main competition. Its high invested capital turns are not enough to offset such low margins. At -2%, Carvana’s ROIC is only better than prior (very successful) Danger Zone pick TrueCar (TRUE).
Figure 4: Carvana’s Profitability vs. Competition: TTM
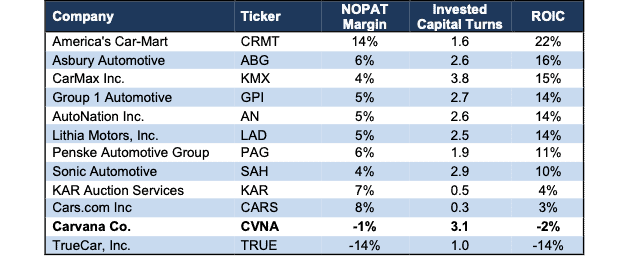
Sources: New Constructs, LLC and company filings.
Valuation Implies Carvana Generates More Sales than the Two Largest Used Car Dealers Combined
We use our reverse discounted cash flow (DCF) model to analyze the future cash flow expectations baked into Carvana’s current valuation. We find that, despite earning negative margins (in a year that saw record used-car prices and low interest rates) and facing fierce competition, Carvana is priced as if it will grow revenues to higher levels than the combined revenues of CarMax (KMX) and AutoNation (AN).
To justify its current price of $90/share, Carvana must:
- immediately improve its NOPAT margin to 3%, (above 2021 NOPAT margin of -1% but below CarMax at 4%) and
- grow revenue by 26% compounded annually (nearly 3x projected industry growth through 2027) for the next seven years.
In this scenario, Carvana’s revenue in 2028 would reach $65.2 billion, which is 113% of the combined TTM revenue of CarMax and AutoNation, the two largest used-car dealers by revenue.
This scenario implies the firm would sell ~2.3 million retail and wholesale vehicles in 2028[1] versus just over 632,000 sold over the last twelve months. Such high sales would be 141% the vehicles sold over the TTM by the largest U.S. used car retailer, CarMax. In a mature market, which used-cars surely are, that much growth requires taking significant market share away from leading competitors. To justify its current valuation Carvana must take market share while also improving margins.
This scenario implies Carvana grows NOPAT from -$83 million in 2021 to $2.0 billion in 2028, which is 158% of CarMax’s fiscal 2022 NOPAT.
Companies that grow revenue by anywhere near 20%+ compounded annually for such a long period are also unbelievably rare, which make the expectations in Carvana’s share price even more unrealistic.
18% Downside Even If Carvana Reaches 2 Million Vehicle Goal
Carvana’s economic book value, or no growth value, is negative $41/share, which illustrates the overly optimistic expectations in its stock price. The firm must achieve significant profit growth to remain a going concern.
Even if we assume Carvana meets its prior stated goal of selling 2 million vehicles per year, shares hold 18% downside from the current price.
If we assume Carvana’s:
- NOPAT margin improves to 3% and
- revenue grows by 23% compounded annually over the next eight years, then
the stock is worth just $74/share today – an 18% downside to the current price. In this scenario, the firm grows revenue to $55.8 billion in 2028 and, assuming Carvana generates ~$28 thousand per vehicle sold (using same assumptions as the prior scenario), the firm would sell 2 million vehicles in 2028.
This scenario also implies Carvana grows NOPAT from -$83 million in 2021 to $1.7 billion in 2028, which is more than 1.3x CarMax’s TTM NOPAT.
Should Carvana fail to grow nearly 3x as fast as the used car industry, the downside is even larger, as we show below.
71% Downside If Carvana Grows At Industry Rates
Below, we review an additional DCF scenario to highlight the downside risk even if Carvana’s revenue grows at the same pace as the used-car industry.
If we assume Carvana’s:
- NOPAT margin improves to 3%,
- revenue grows at consensus rates in 2022 and 2023, and
- revenue grows by 9% a year from 2024 through 2028 (equal to projected industry growth rate through 2027), then
the stock is worth just $26/share today – a 71% downside to the current price. In this scenario, the firm grows revenue to $30.9 billion in 2028, and assuming Carvana generates ~$28 thousand per vehicle sold (using same assumptions as prior scenarios), the firm would sell 1.1 million vehicles in 2028, a near doubling from TTM levels and 69% of the vehicles sold by CarMax in its fiscal 2022.
This scenario implies Carvana grows NOPAT from -$83 million in 2021 to $926 million in 2028, which is 75% of CarMax’s fiscal 2022 NOPAT.
Figure 5 compares Carvana’s implied future NOPAT in these three scenarios to its historical NOPAT. We also include the TTM NOPAT for CarMax and AutoNation for reference.
Figure 5: Carvana’s Historical and Implied NOPAT: DCF Valuation Scenarios
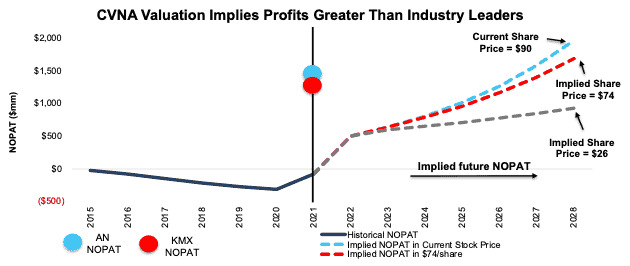
Sources: New Constructs, LLC and company filings.
Each of the above scenarios also assumes Carvana grows revenue, NOPAT, and FCF without increasing working capital or fixed assets. This assumption is highly unlikely but allows us to create best-case scenarios that demonstrate the expectations embedded in the current valuation. For reference, Carvana’s invested capital grew 86% compounded annually from 2015 through 2021. If we assume Carvana’s invested capital increases at a similar rate in DCF scenarios 2 and 3 above, the downside risk is even larger.
Check out this week’s Danger Zone interview with Chuck Jaffe of Money Life.
This article originally published on April 25, 2022.
Disclosure: David Trainer, Kyle Guske II, and Matt Shuler receive no compensation to write about any specific stock, sector, style, or theme.
Follow us on Twitter, Facebook, LinkedIn, and StockTwits for real-time alerts on all our research.
[1] Calculated by taking the implied revenue divided by the implied revenue per vehicle. Over the TTM, Carvana generated a total of $14.1 billion in revenue and sold 632 thousand combined retail and wholesale vehicles, which equates to ~$22.2 thousand in revenue per unit sold. Assuming inflation of 3.5% per year, revenue per unit sold in 2028 would be ~$28.3 thousand.