We published an update on this Long Idea on April 27, 2022. A copy of the associated Earnings Update report is here.
CarMax Inc. (KMX: $96/share) is this week’s Long Idea. We’re also offering a pair trade idea: long KMX and short CVNA.
We warned fiduciaries in August 2020 about the extreme risk in investing in Carvana Co. (CVNA). The stock is even riskier today given its 20% rise (S&P 500 +6%) since our original report. Meanwhile, the expectations baked into the price of the much more profitable and market-share leader CarMax are considerably less.
Despite CarMax’s year-over-year decline in trailing-twelve-months (TTM) revenue, we think this stock offers excellent risk/reward based on CarMax’s:
- Leading market position and long history of growing faster than its peers
- Online and in-store capabilities
- Procurement and inventory efficiencies derived from its superior scale
- Stock trading as if profits will never grow.
CarMax Is the Market Share Leader by Far
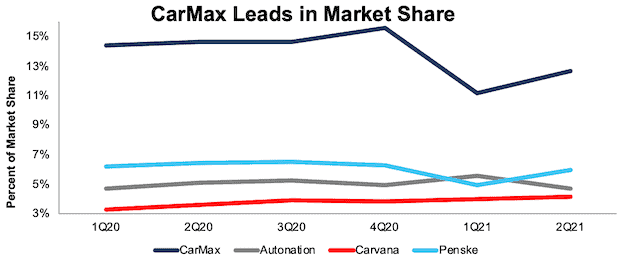
Even after the COVID-19 pandemic forced approximately half of the firm’s stores to either close or operate on a limited basis, CarMax generates more revenue from retail used car sales than any other car dealership in the U.S. While the firm’s TTM market share (measured as company retail used car sales as a percent of total retail used car sales) is down from fiscal 2020, CarMax is already recovering market share it lost during the pandemic. Per Figure 1, the CarMax improved its market share from 10.6% in fiscal 1Q21 to 12.2% in fiscal 2Q21.
Figure 1: CarMax & Peers’ Share of U.S. Retail Used Car Sales
Sources: New Constructs, LLC, company filings & FRED
Longer term, CarMax has consistently grown its share of the U.S. retail used car market from 5% in 2003 to 13% over the trailing-twelve months (TTM).
Now a Leader in Touchless and Online
Long before the onset of the COVID-19 pandemic, CarMax identified the need to update its business model to maintain competitive advantages over the long term. Since 2018, the firm has offered a new sales process in select markets that gives customers the flexibility to begin and complete the buying process fully online, in-store, or some combination of the two. CarMax completed the nationwide rollout of this program in fiscal 2Q21, allowing the firm to meet a broad range of preferences for all of its customers with a flexible sales process.
If this strategy sounds familiar, it should. Carvana’s first-mover advantage in online sales is slipping away. Carvana’s key differentiator is its fully online, touchless approach to the car buying process, which CarMax is already replicating. With no-haggle pricing, contactless delivery, and the option to complete the entire car buying process online, CarMax is offering the same services as Carvana. In many cases, CarMax offers its customers even more (see below).
Brick & Mortar Creates Additional Advantages
CarMax’s 225 stores are a major advantage over its competition, especially Carvana, whose model of buying a car sight unseen does not work for most consumers in the vehicle market. A survey conducted by Urban Science and Harris Poll found that 83% of consumers would not buy a vehicle without first test driving it. 89% of the respondents indicated that the test drive was the most influential resource in their decision. Furthermore, younger consumers shop more at brick-and-mortar dealerships than older consumers. Gen Z and young millennials visit 3.8 stores on average before purchasing a vehicle while Generation X and Baby Boomers visit just over 2 dealerships.
The Internet Is the Best Vending Machine – and CarMax Is Fully Stocked
CarMax’s large inventory of used vehicles enables it to sell more vehicles no matter the sales channel. At the end of fiscal 2020, CarMax had an inventory of ~80,000 vehicles, which can be transported across the United States to facilitate a sale. For reference, Carvana’s inventory is ~20,000 vehicles. In fiscal 2020, 34% of CarMax’s vehicles sold were transported at the customer’s request. This large inventory, coupled with the superior distribution network created by its dealerships, enables CarMax customers to enjoy a wider selection of vehicles as well as more pick-up/buying locations.
Wholesale Business Maintains Retail Quality Standards and Deepens Market Insights
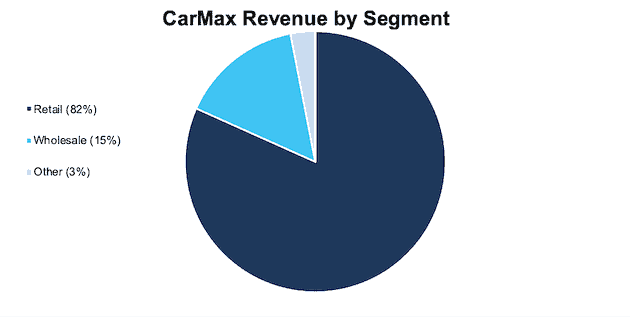
CarMax operates the third largest (by total number of vehicles sold) wholesale auction house in the U.S. Per Figure 2, CarMax’s wholesale revenue comprised 15% of CarMax’s total revenue in fiscal 2Q21. While the wholesale business added $2.5 billion to the firm’s top line, it also plays an essential role in the firm’s much larger retail segment.
Figure 2: CarMax’s Revenue by Segment as of Fiscal 2Q21
Sources: New Constructs, LLC, company filings
Before the pandemic, CarMax held auctions every one-to-two weeks at 76 locations across the country where the firm sold inventory acquired from customers that did not meet the firm’s retail standards. These auctions are now held online due to COVID-19 and complement the retail business by:
- maintaining the quality of its retail offerings through offloading lower-quality vehicles at its auctions
- providing the firm with real-time insights into pricing and demand in the U.S. used car market.
In other words, CarMax has better infrastructure for selling/buying a large volume of cars along with better insights into how to price those cars for the wholesale and retail markets.
Appraisal Process Provides Valuable Inventory Sourcing
CarMax will appraise any vehicle brought to its stores and make a written guaranteed offer to buy that vehicle regardless of whether the owner is purchasing a vehicle from the firm. Most of the cars CarMax sells at its auctions are acquired through this appraisal process. Even though approximately half of the vehicles acquired through the appraisal process meet CarMax’s retail standards, the firm procures 36% to 41% of its inventory through this program. By directly sourcing vehicles from customers, CarMax can avoid the $300 to $2000 fees that auctions charge dealers per car in addition to shipping costs.
Further, CarMax’s superior brick & mortar presence gives customers more places to buy and sell cars from them.
Used Car Industry Has Recovered to Pre-Pandemic Sales Levels
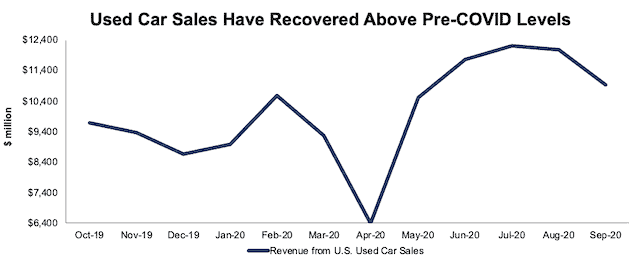
After declining from $10.6 billion in February 2020 to a low of $6.4 billion in April 2020, monthly used car sales have recovered to pre pandemic levels. Sales in September 2020 were $10.9 billion. The resiliency of the U.S. used car market provides a strong tailwind for the industry’s largest dealer.
Importantly, used car sales are expected to continue growing beyond the current year. Cox Automotive notes supply of used cars remains tight but demand high, which bodes well for dealers. Additionally, demand is projected to “remain strong” through 2021.
Figure 3: Monthly U.S. Used Car Sales
Sources: New Constructs, LLC, company filings & FRED
EV Does Not Impact CarMax’s Business – Only Creates Additional Opportunity
There may be lots of questions for traditional automakers and car dealerships heavily dependent on new car sales as to how the adoption of electric vehicles (EV) will impact their businesses. Regardless of how EVs affect the automobile industry, CarMax is positioned to continue to sell cars, whether they are conventional, hybrid, or electric vehicles.
Profitability Is Best in Class
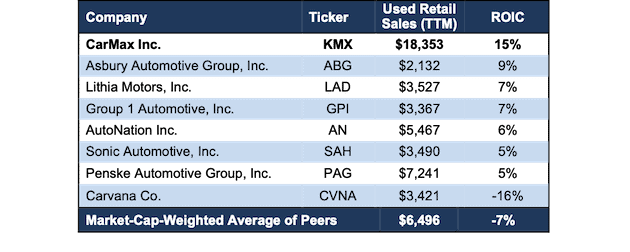
CarMax’s competitive advantages manifest not only in more than twice as much revenue from used car sales as the next largest competitor, but it also has the highest return on invested capital (ROIC) amongst its peers.
Peers include the seven largest (by used vehicle retail sales) firms: Penske Automotive Group, Inc. (PAG), AutoNation Inc. (AN), Lithia Motors, Inc. (LAD), Sonic Automotive, Inc. (SAH), Carvana, Group 1 Automotive, Inc. (GPI), and Asbury Automotive Group, Inc. (ABG).
Figure 4: CarMax’s ROIC vs. Peers’
Sources: New Constructs, LLC and company filings.
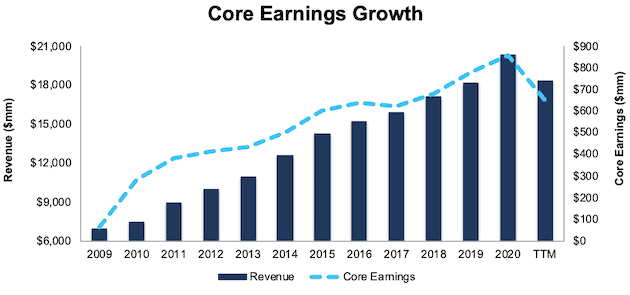
CarMax’s superior profitability drives the firm’s consistent growth in Core Earnings[1]. CarMax has grown Core Earnings by 7% compounded annually over the past five years and 12% compounded annually over the past decade. The firm increased its Core Earnings margin from 1% in 2009 to 4% TTM. The dip in TTM Core Earnings is similar that what we saw in our See Through the Dip stocks, where the pandemic impacted sales in the short term but is expected to have less effect as the economy recovers.
Figure 5: CarMax’s Revenue & Core Earnings Since 2009
Sources: New Constructs, LLC and company filings.
CarMax’s rising profitability helps the business generate significant free cash flow (FCF). The company generated positive FCF in each of the past 11 years and a cumulative $1.6 billion (11% of market cap) in FCF over the past five years.
KMX Is Undervalued
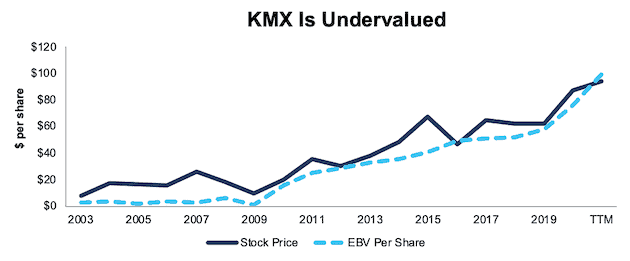
Despite being the largest and most profitable used car dealer, KMX trades at its economic book value (EBV), or no-growth value. Its current price-to-economic book value (PEBV) ratio of 1.0 is the cheapest since 2016. This ratio means the market expects CarMax’s NOPAT to never meaningfully grow from current levels. This expectation seems overly pessimistic over the long term. For reference, CarMax has grown NOPAT by 12% compounded annually over the past decade.
CarMax’s current economic book value is $99/share – a 3% upside to the current stock price.
Figure 6: CarMax’s Stock Price & Economic Book Value per Share Since 2003
Sources: New Constructs, LLC and company filings.
Huge Divergence in Expectations for CarMax and Carvana
Below, we use our reverse DCF model to quantify the cash flow expectations baked into CarMax’s current stock price. Then, we analyze the implied value of the stock based on different assumptions about CarMax’s future growth in cash flows.
Scenario 1: In this worst-case scenario, we assume:
- NOPAT margin falls to 4% (five-year low compared to 6% TTM)
- Revenue grows 1.6% compounded annually for ten years (compared to 5% compounded annual consensus estimated revenue growth from 2021 to 2025)
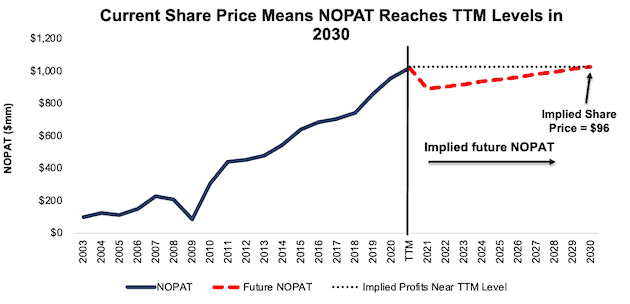
In this scenario, CarMax’s revenue reaches $23.8 billion 10 years from now, and the stock is worth $96/share today – nearly equal to the current stock price. See the math behind this reverse DCF scenario.
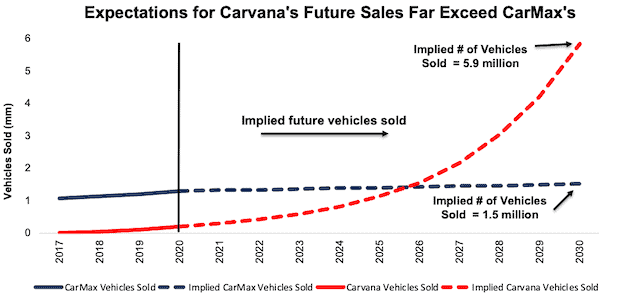
In fiscal 2020, CarMax generated $20.3 billion of revenue and sold 1.3 million combined retail and wholesale vehicles – or ~$16 thousand in revenue per vehicle sold. Assuming the firm continues to generate ~$16 thousand in revenue per vehicle sold, CarMax would need to sell just 1.5 million retail and wholesale vehicles in 2030 to achieve the $23.8 billion of revenue implied in this scenario.
For comparison, Carvana generated $3.9 billion of revenue and sold 217 thousand combined retail and wholesale vehicles – or ~$18 thousand in revenue per vehicle sold. To justify its current price, Carvana would need to achieve CarMax’s TTM NOPAT margin of 6% and grow revenue by 39% compounded annually over the next decade. In this scenario, Carvana generates $106 billion in revenue. Assuming the firm continues to generate ~$18 thousand in revenue per vehicle sold, Carvana would need to sell 5.9 million retail and wholesale vehicles to achieve the $106 billion of revenue implied by its current share price. See the math behind this reverse DCF scenario.
Figure 7 compares CarMax’s and Carvana’s historical and implied number of vehicles sold based on the expectations baked into each share price. The drastic differences in expectations when compared to each firms’ fundamentals are why CarMax and Carvana present a great Long/Short pair trade opportunity.
Figure 7: Scenario 1: CarMax’s and Carvana’s Historical and Implied Vehicles Sold
Sources: New Constructs, LLC and company filings.
Figure 8 compares CarMax’s implied future NOPAT in this scenario to its historical NOPAT. This worst-case scenario implies CarMax’s NOPAT a decade from now will be just 1% above its fiscal 2020 NOPAT. In any scenario better than this one, KMX holds significant upside potential, as we’ll show below.
Figure 8: Scenario 1: CarMax’s Historical and Implied NOPAT
Sources: New Constructs, LLC and company filings.
Scenario 2: Big Upside With Consensus Growth Rates
If CarMax grows revenue equal to consensus estimates, KMX is worth much more than its current price. In this scenario we assume:
- NOPAT margin falls to 5% (equal to fiscal 2020 margin compared to 6% TTM)
- Revenue grows 5% compounded annually from 2021 to 2025 (consensus estimates) and grows at 3% a year thereafter, which is below the average global GDP growth rate since 1961 (3.5%)
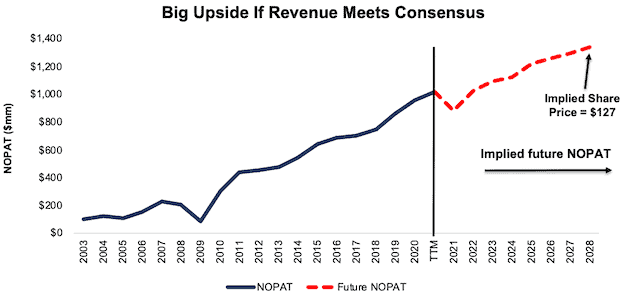
In this scenario, where CarMax’s NOPAT grows by just 4% compounded annually over the next 10 years, the stock is worth $127 /share today – a 32% upside to the current stock price. See the math behind this reverse DCF scenario.
Figure 9 compares the firm’s implied future NOPAT in this scenario to its historical NOPAT.
Figure 9: Scenario 2: CarMax’s Implied NOPAT at Consensus Revenue Estimates
Sources: New Constructs, LLC and company filings.
Sustainable Competitive Advantages Will Drive Shareholder Value Creation
Here’s a summary of why we think the moat around CarMax’s business will enable it to continue to generate higher NOPAT than the current market valuation implies. The following competitive advantages help CarMax grow its market share over the long term:
- Largest and most profitable firm in its industry
- Omni channel sales process that meets varied online and brick-and-mortar/test drive needs
- Inventory and cost advantages from its wholesale business
- Large inventory availability for customers
What Noise Traders Miss With CarMax
These days, fewer investors focus on finding quality capital allocators with shareholder friendly corporate governance. Instead, due to the proliferation of noise traders, the focus is on short-term technical trading trends while high-quality fundamental research is overlooked. Here’s a quick summary of what noise traders are missing:
- Significant rebound in used car demand to above pre-pandemic levels
- Successful nationwide implementation of the firm’s online sales
- Valuation implies profits never exceed TTM levels
Catalysts: A Consensus Beat & Increased Sales from Hybrid Sales Channel
At the end of February 2020, consensus earnings per share estimates for CarMax’s fiscal 2021 were $6.22. Jump forward to today, and consensus estimates have fallen to just $5.68/share.
According to Zacks, CarMax beat EPS estimates in nine of the past 10 quarters and doing so again could send shares higher.
Furthermore, if the firm achieves increased sales through the continued implementation of its online/in-store hybrid sales experience, investors could take notice the firm is well positioned for future growth and send shares higher.
Lastly, if Carvana fails to meet the sales expectations baked into its stock price, investors may see the writing on the wall and rotate their money into the more profitable and undervalued industry leader.
Share Repurchases Could Provide an Impressive 10% Yield
CarMax has never paid a dividend on its common stock and does not plan to pay one for the foreseeable future. Instead, the firm has returned capital to shareholders through share repurchases. Over the past five years, CarMax repurchased $3.6 billion (24% of market cap) worth of shares. After suspending the repurchase program in March 2020, the firm resumed repurchases in September 2020. $1.5 billion remains on CarMax’s repurchase authorization. Should the firm use all of this authorization, investors would see a 10% yield at current prices.
Executive Compensation Could Be Improved
No matter the macro environment, investors should look for companies with executive compensation plans that directly align executives’ interests with shareholders’ interests. Quality corporate governance holds executives accountable to shareholders by incentivizing them to allocate capital prudently.
CarMax’s executive compensation plan pays annual cash bonuses and long-term equity awards. Annual incentive bonuses are linked to an adjusted EBIT target. CarMax also grants 1/3 of its performance stock units using a multiplier determined by the firm’s performance against a one-year adjusted diluted earnings per share goal.
We would prefer the firm use ROIC improvement when determining executive compensation, as there is a strong correlation between improving ROIC and increasing shareholder value. Having accurate values for NOPAT and invested capital ensures investors have an apples-to-apples metric for measuring corporate performance and holds management accountable for every dollar invested into the company.
Despite not using ROIC when measuring performance, CarMax’s compensation plan has not compensated executives while destroying shareholder value. CarMax has grown economic earnings by 7% compounded annually over the past five years and by 12% compounded annually over the past decade.
Insider Trading and Short Interest Trends
Over the past twelve months, insiders have bought a total of 133 thousand shares and sold 1.1 million shares for a net effect of 1.0 million shares sold. These sales represent less than 1% of shares outstanding.
There are currently 9.5 million shares sold short, which equates to 6% of shares outstanding and six days to cover. Short interest is up 3% from the prior month. The low short interest indicates not many investors are willing to bet against this firm.
Critical Details Found in Financial Filings by Our Robo-Analyst Technology
As investors focus more on fundamental research, research automation technology is needed to analyze all the critical financial details in financial filings as shown in the Harvard Business School and MIT Sloan paper, "Core Earnings: New Data and Evidence”.
Below are specifics on the adjustments we make based on Robo-Analyst findings in CarMax’s fiscal 2020 10-K and fiscal 2Q21 10-Q:
Income Statement: we made $186 million of adjustments, with a net effect of removing $70 million in non-operating expenses (< 1% of revenue). You can see all the adjustments made to CarMax’s income statement here.
Balance Sheet: we made $1.0 billion of adjustments to calculate invested capital with a net decrease of $146 million. One of the largest adjustments was $158 million in change in reserves. This adjustment represented 2% of reported net assets. You can see all the adjustments made to CarMax’s balance sheet here.
Valuation: we made $3.1 billion of adjustments with a net effect of decreasing shareholder value by $2.8 billion. Apart from total debt, one of the most notable adjustments to shareholder value was $205 million in outstanding ESOs. This adjustment represents 1% of CarMax’s market cap. See all adjustments to CarMax’s valuation here.
Attractive Funds That Hold KMX
The following funds receive our Attractive-or-better rating and allocate significantly to KMX:
- FAM Value Fund (FAMVX) – 4.7% allocation and Attractive rating
- Touchstone Mid Cap Fund (TMCPX) – 3.8% allocation and Attractive rating
- Touchstone Large Cap Fund (TLCYX) – 3.5% allocation and Very Attractive rating
This article originally published on December 16, 2020.
Disclosure: David Trainer, Kyle Guske II, and Matt Shuler receive no compensation to write about any specific stock, style, or theme. Follow us on Twitter, Facebook, LinkedIn, and StockTwits for real-time alerts on all our research.
[1] Our Core Earnings are a superior measure of profits, as demonstrated in Core Earnings: New Data & Evidence a paper by professors at Harvard Business School (HBS) & MIT Sloan. Recently accepted by the Journal of Financial Economics, the paper proves that our data is superior to all the metrics offered by S&P Global (SPGI).
