We published an update on this Danger Zone pick on August 15, 2022. A copy of the associated report is here.
A difficult economic environment and choppy markets are forcing investors to take a closer look at the fundamentals of stocks they own. As we warned at the beginning of the year, stocks of businesses that produce lower returns on invested capital (ROIC) will continue to underperform the wider market.
This report focuses GameStop (GME: $150/share), which is back in the Danger Zone this week. We focus on Carvana (CVNA: $90/share) in a separate report here.
Risk-Off Leaves Weak Firms Exposed
As markets take a risk-off approach, easy money dries up, and the global economy faces continued headwinds from inflation, supply chain disruption, and labor shortages, investors need to re-evaluate their portfolios.
In this environment, strong top-line growth doesn’t satisfy markets. Instead, investors should focus on more reliable fundamental metrics: Core Earnings and ROIC. Stocks for companies with poor fundamentals suffer more in this market because, too often, their valuations are built on overhyped future profit growth hopes. When the growth stories and hype reach an end, these stocks fall fast and far. Just look at Netflix (NFLX).
Trust the Track Record
76% of our open Danger Zone picks and IPO warnings have fallen more than the S&P 500 YTD (as of closing prices on April 22, 2022). 85% of these picks have negative year-to-date (YTD) returns. Figure 1 shows the YTD performance of our open Danger Zone picks and IPO warnings. On average, our Danger Zone picks have fallen 26% YTD compared to a 10% decline in the S&P 500.
Figure 1: Danger Zone Picks Outperform as Shorts in Turbulent Markets
Sources: New Constructs, LLC and company filings.
Negative returns indicate a decline in stock price, and therefore, a winning short pick.
Most Danger Zone picks are particularly dangerous to own, even after precipitous falls in 2022, because of:
- negative and/or falling Core Earnings
- low and/or negative ROICs
- negative free cash flow (FCF)
- valuations that imply unrealistic growth in future cash flows
Below we highlight the high level of risk in owning GameStop.
GameStop Outperformed as Short by 31%, Could Fall 68% More
We first made GameStop a Danger Zone pick in April 2021 and since then the stock is down 26% while the S&P 500 is up 5%. GameStop still has further to fall, given its poor fundamentals and expectations baked into its stock price, as we’ll show below
The Meme-Stock Playbook In Effect
GameStop is following the meme-stock playbook used by other companies, like Tesla, to prop up its stock price.
Play #1 – Overpromise Loudly and Underdeliver: when Ryan Cohen first entered his GameStop stake, and ultimately assumed the role of Chairman of the Board, he claimed GameStop would become the Amazon of gaming. The results of this claim/strategy have not met expectations, to say the least.
Play #2 – Announce a New Business/Go Crypto: The cryptocurrency market has garnered significant attention and helped prop up other company’s stock prices. Sometimes a simple a mention of bitcoin in a press release or earnings call can drive a stock up. GameStop followed this play by launching a non-fungible token (NFT) marketplace to capitalize on the crypto/NFT demand.
Play #3 – Split the Stock: In August 2020, Tesla split its stock and saw its price nearly double in the five months following. Despite a stock split having zero impact on a business’ operations, GameStop followed a similar play and announced plans for a stock split. Lower stock prices are attractive to retail meme-stock buyers, especially those treating call options like lottery tickets. However, GME didn’t get the same results as Tesla, as the stock trades ~11% lower than the day the split was announced.
Meme-Stock Playbook Hasn’t Fixed a Poor Business
Despite boardroom and executive changes, GameStop remains a lagging brick-and-mortar retailer in an increasingly online world.
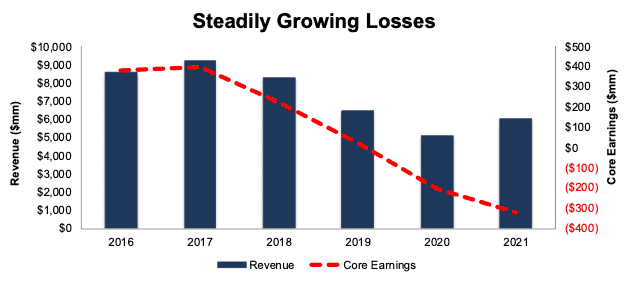
Even after a bump in fiscal 2021 (FYE 1/29/22), GameStop’s revenue has fallen at an average rate of 7% compounded annually over the past five years. Core Earnings have fallen from $382 million in fiscal 2016 to -$321 million in fiscal 2021. Over the past three years, GameStop has burned a cumulative -$474 million in FCF. Meanwhile, since the beginning of calendar 2017, GME has increased from $25/share to $148/share, which shows the unfounded optimism baked into shares.
Figure 2: GameStop’s Revenue & Core Earnings Fiscal 2017
Sources: New Constructs, LLC and company filings
Profitability Significantly Lags Competitors
GameStop was a struggling brick-and-mortar retailer before its meme-stock run, and with the rapid growth in ecommerce, as well as the increasingly digitized nature of video game sales, becoming competitive again will be no easy task. Per Figure 3, GameStop’s net operating profit after-tax (NOPAT) margin, invested capital turns, and ROIC all rank below its main competitors, Best Buy (BBY), Target (TGT), Amazon (AMZN), and Walmart (WMT).
Figure 3: GameStop’s Profitability Ranks Last Among Competition
Sources: New Constructs, LLC and company filings
GME Is Priced to Generate 2.8x the Revenue of Activision Blizzard
We use our reverse discounted cash flow (DCF) model to analyze the expectations for future profit growth implied by GameStop’s stock price. In doing so, we find that at $150/share, GameStop is priced as if it will immediately reverse falling margins and grow revenue at an unrealistic rate for an extended period.
Specifically, to justify its current price GameStop must:
- improve its NOPAT margin to 3% (its three-year average prior to COVID-19, compared to -5% TTM) and
- grow revenue by 15% compounded annually for the next 10 years (1.5x the projected video game industry growth through calendar 2027)
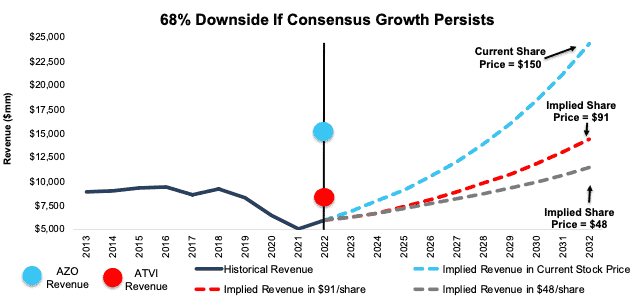
In this scenario, GameStop earns over $24.3 billion in revenue in fiscal 2032 or 2.8x the 2021 revenue of Activision Blizzard (ATVI), 156% of the revenue of successful auto parts retailer AutoZone (AZO), and nearly half the fiscal 2022 revenue of Best Buy. For reference, GameStop’s revenue fell by 5% compounded annually from fiscal 2011 to fiscal 2021.
In this scenario, GameStop would also generate $681 million in NOPAT in 2032, which would be 1.6x greater than the company’s highest ever NOPAT, which occurred in fiscal 2011.
There Is a 39%+ Downside at Industry Growth Rates: In this scenario, GameStop’s:
- NOPAT margin improves to 3%,
- revenue grows at consensus rates in fiscal 2023 and 2024, and
- revenue grows 10% a year from fiscal 2025 through fiscal 2032 (slightly above the projected industry growth rate through calendar 2027), then
the stock is worth just $91/share today – a 39% downside to the current price. If GameStop’s growth continues to slow, or its turnaround stalls completely, the downside risk in the stock is even higher, as we show below.
There Is a 68%+ Downside If Growth Slows to Consensus Rates: In this scenario, GameStop’s
- NOPAT margin improves to 2% over three years (equal to 10-year average),
- revenue grows at consensus rates in fiscal 2023 and 2024, and
- revenue grows 6.9% a year from fiscal 2025 through fiscal 2032 (continuation of fiscal 2024 consensus), then
the stock is worth just $48/share today – a 68% downside to the current price.
Figure 4 compares the firm’s historical revenue and implied revenue for the three scenarios we presented to illustrate just how high the expectations baked into GameStop’s stock price remain. For reference, we also include the 2021 revenue of Activision Blizzard and AutoZone.
Figure 4: GameStop’s Historical Revenue vs. DCF Implied Revenue
Sources: New Constructs, LLC and company filings
Check out this week’s Danger Zone interview with Chuck Jaffe of Money Life.
This article originally published on April 25, 2022.
Disclosure: David Trainer, Kyle Guske II, and Matt Shuler receive no compensation to write about any specific stock, sector, style, or theme.
Follow us on Twitter, Facebook, LinkedIn, and StockTwits for real-time alerts on all our research.


