
This report is an abridged and free version of S&P 500 & Sectors: Core Earnings Vs. GAAP Earnings Through 2Q21, one of the reports in our quarterly series on fundamental market and sector trends, which is available to Pro and higher members. More free reports are available here.
The full version of the report analyzes the Core Earnings[1] and GAAP earnings of the S&P 500 and each of its sectors (last quarter’s analysis is here). The most recent Core Earnings and GAAP Earnings values are based on the latest audited financial data, which is the calendar 2Q21 10-Q for most companies.
These reports leverage more reliable fundamental data[2] that overcomes flaws with legacy fundamental datasets. Our research provides a more informed view of the fundamentals and valuations of companies and sectors. Our Earnings Distortion research has been shown to generate substantial idiosyncratic alpha.
Core Earnings Are Better than GAAP Earnings
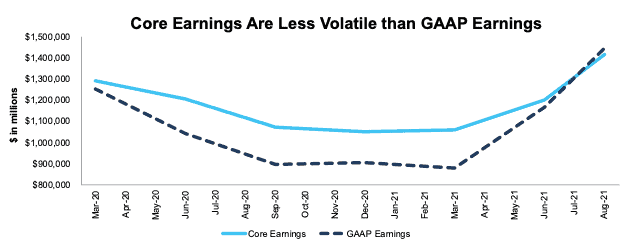
Figure 1 shows Core Earnings provide a less volatile measure of earnings than GAAP earnings. For instance:
- GAAP earnings fell 30% YoY in 2020 while Core Earnings, which adjust for unusual gains/losses, fell just 18% YoY.
- On the flip side, GAAP earnings rose 65% since the end of 2020, while Core Earnings rose only 34% over the same time.
In other words, corporate profits were not as bad, nor has the rebound been as robust, as GAAP earnings led investors to believe during the COVID crisis.
Figure 1: S&P 500 Core Earnings Vs. GAAP: 4Q19 – 2Q21
Sources: New Constructs, LLC and company filings.
Our Core Earnings analysis is based on aggregated TTM data for the sector constituents in each measurement period.
The August 18, 2021 measurement period incorporates the financial data from calendar 2Q21 10-Qs, as this is the earliest date for which all the calendar 2Q21 10-Qs for the S&P 500 constituents were available.
We warned investors to expect an overstated rebound in GAAP earnings in our 1Q21 All Cap Core Earnings vs. GAAP Earnings analysis, where we noted
“depressed GAAP earnings throughout 2020, largely due to record write-downs, means companies are set up for record YoY comps and growth in 2021. Accordingly, investors should take the reported earnings growth in 2021 with a grain of salt.”
Key Details on Select S&P 500 Sectors
Within the S&P 500, all but two sectors saw a year-over-year (YoY) rise in Core Earnings in 2Q21. This improvement in Core Earnings is more widespread than last quarter, when four sectors saw a YoY decline in Core Earnings.
The Financials sector saw the largest % YoY improvement in Core Earnings, which rose from $196 billion in 2Q20 to $311 billion in 2Q21.
The Technology sector generates the most Core Earnings of any sector and grew Core Earnings by 38% YoY in 2Q21. On the flip side, the Energy sector has the lowest Core Earnings and the Industrials sector had the largest YoY drop in 2Q21. Below we highlight the Consumer Cyclicals sector and a stock with some of the most Earnings Distortion in the sector.
Sample Sector Analysis[3]: Consumer Cyclicals Sector
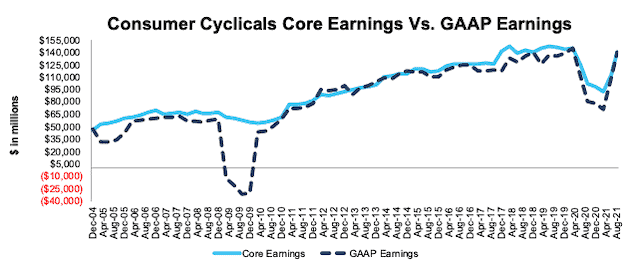
Figure 2 shows Core Earnings for the Consumer Cyclicals sector rose 38% YoY in 2Q21, while GAAP earnings rose 75% over the same time. The COVID-19 pandemic impacted the Consumer Cyclicals sector Core Earnings more than the Financial Crisis when Core Earnings were largely unchanged.
Figure 2 also highlights how GAAP Earnings overstated the Consumer Cyclicals sector’s decline in profits during 2020 when compared to Core Earnings. GAAP Earnings fell 51% from 4Q19 to 4Q20, while Core Earnings fell 37% over the same time.
Figure 2: Consumer Cyclicals Core Earnings Vs. GAAP: 2004 – 2Q21
Sources: New Constructs, LLC and company filings.
Our Core Earnings analysis is based on aggregated TTM data for the sector constituents in each measurement period.
The August 18, 2021 measurement period incorporates the financial data from calendar 2Q21 10-Qs, as this is the earliest date for which all the calendar 2Q21 10-Qs for the S&P 500 constituents were available.
Core Earnings Distortion Details: Lowe’s Companies (LOW)
Below, we detail the hidden and reported unusual items that aren’t captured in GAAP Earnings that are captured in Core Earnings for Lowe’s Companies (LOW), a stock with some of the most Earnings Distortion in the Consumer Cyclicals sector. After adjusting for these items, we find that Lowe’s Core Earnings of $10.24/per share are greater than reported GAAP Earnings of $9.16/per share. Lowe’s Earnings Distortion Score is Beat. Our stock rating for LOW is Attractive.
Figure 3 details the differences between Core Earnings and GAAP Earnings so readers can audit our research.
Figure 3: Lowe’s GAAP Earnings to Core Earnings Reconciliation: TTM through Calendar 2Q21

Sources: New Constructs, LLC and company filings.
More details:
Hidden Unusual Expenses, Net = -$133 million or -$0.18/per share
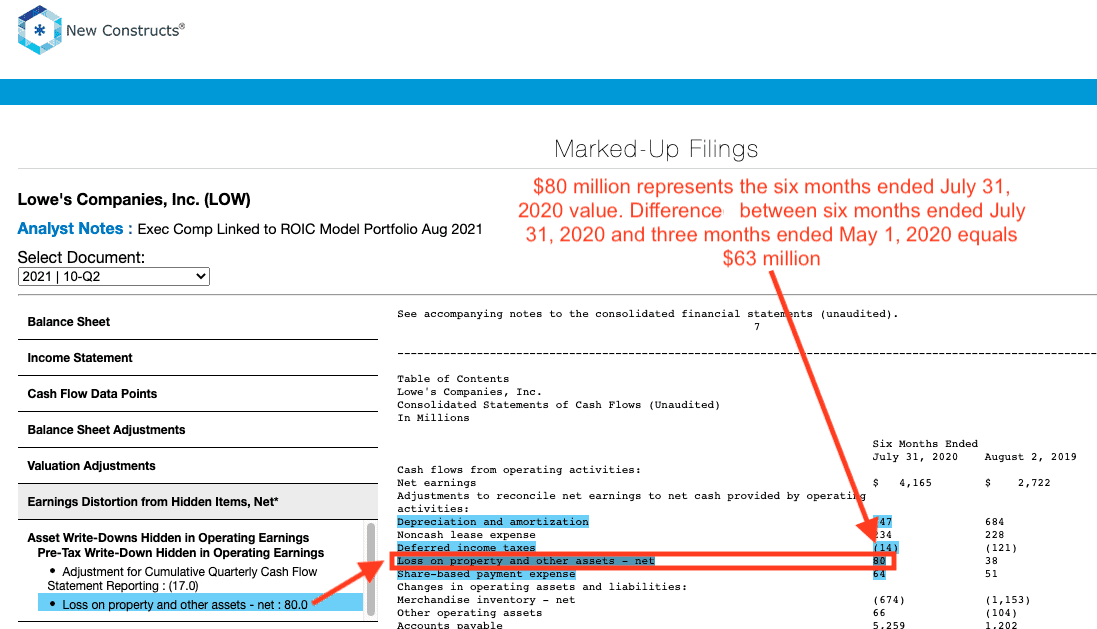
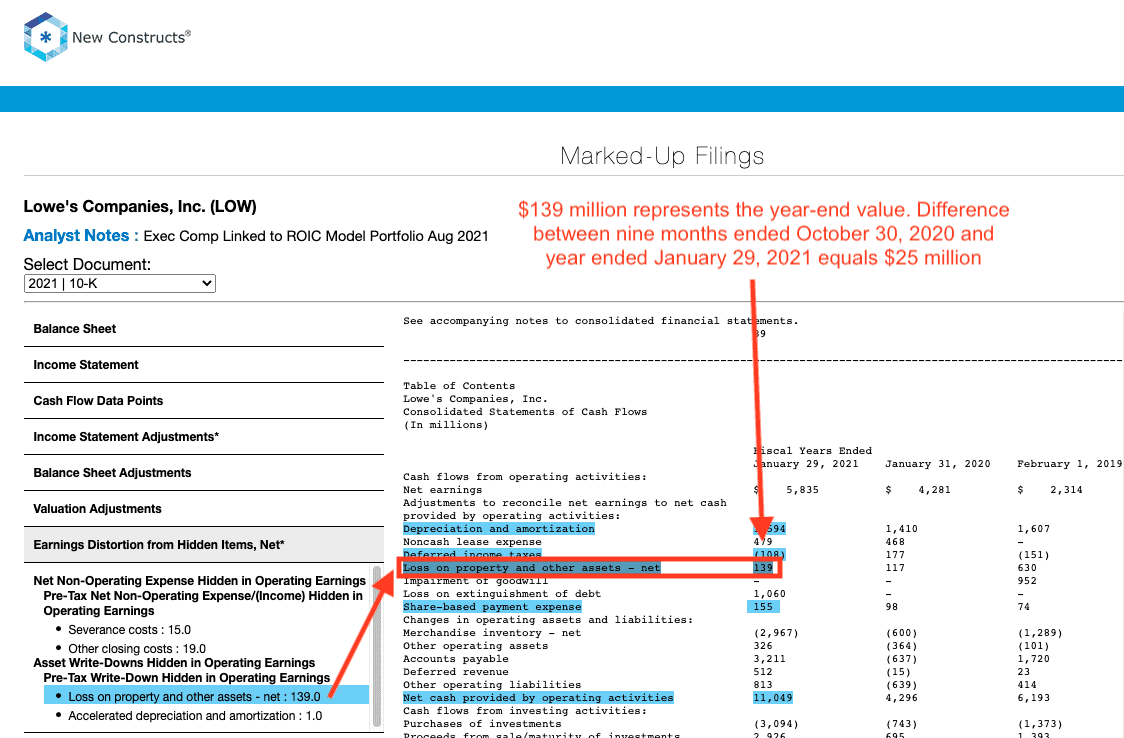
- -$107 million loss on property and other assets in the TTM period, based on
- -$63 million loss in 2Q20
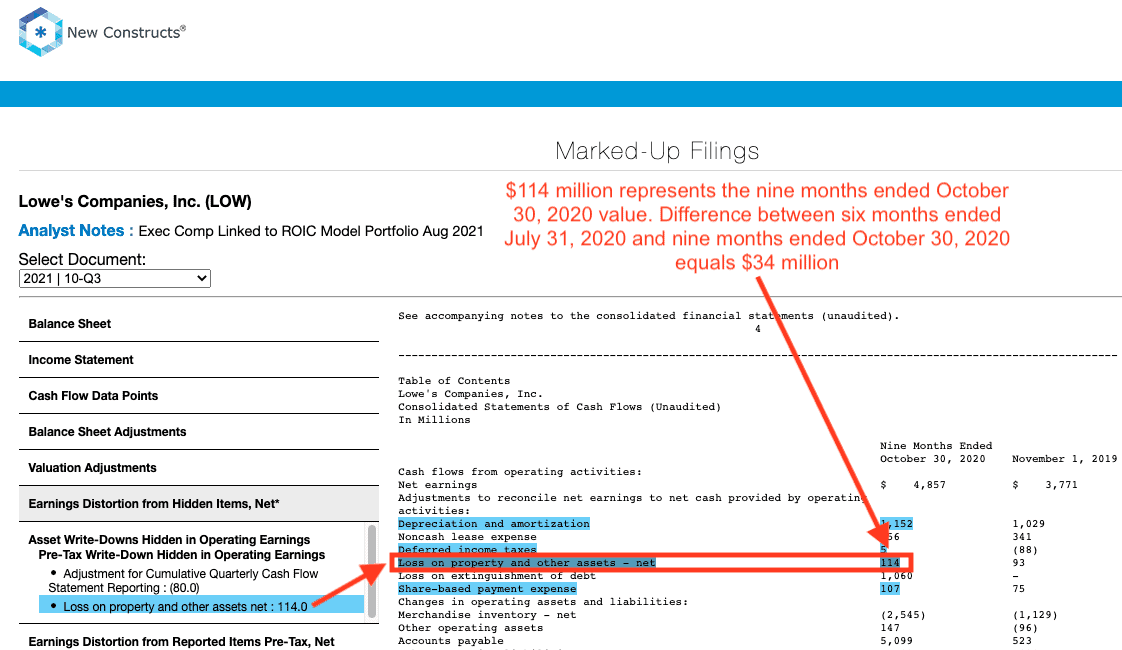
- -$34 million loss in 3Q20
- -$25 million loss in 4Q20
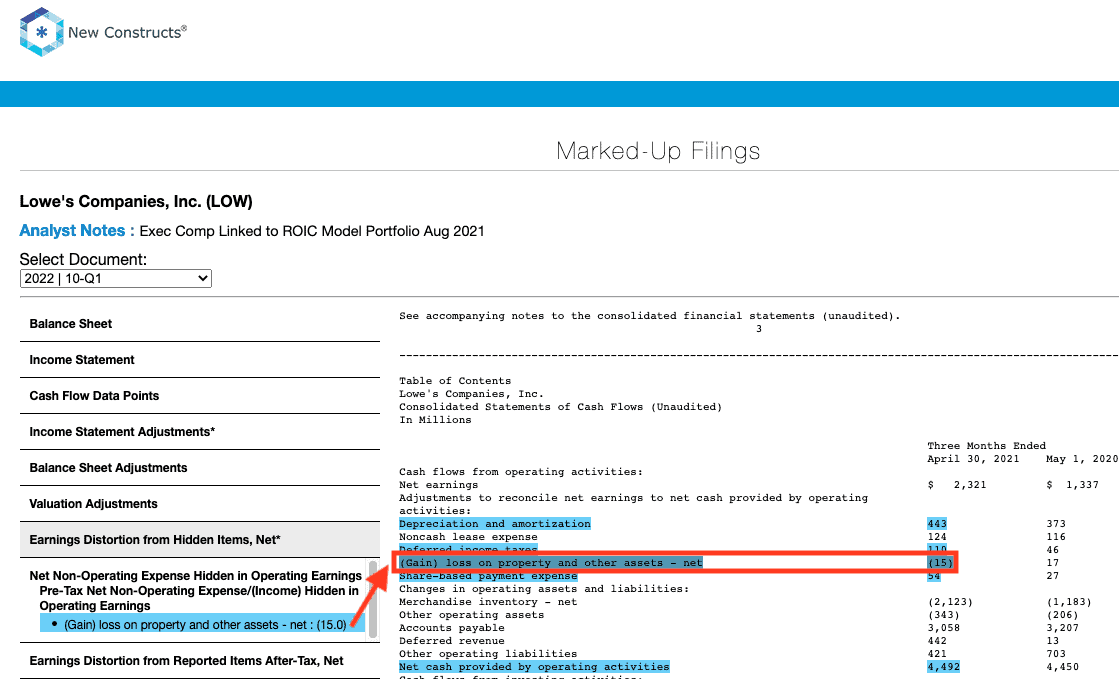
- $15 million gain in 1Q21
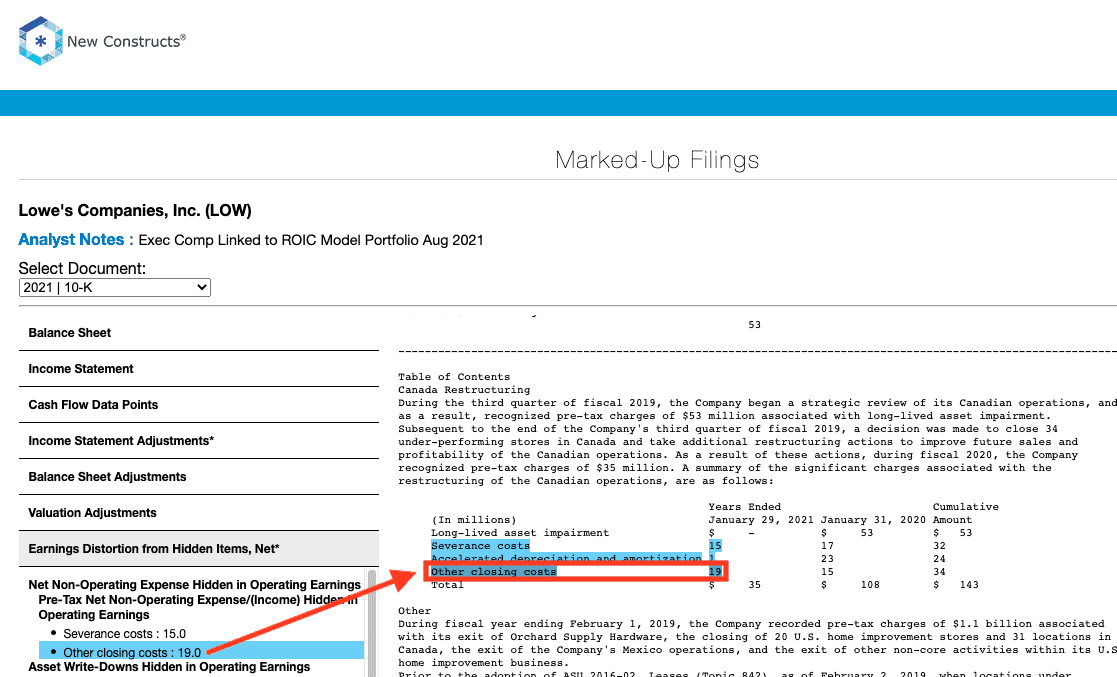
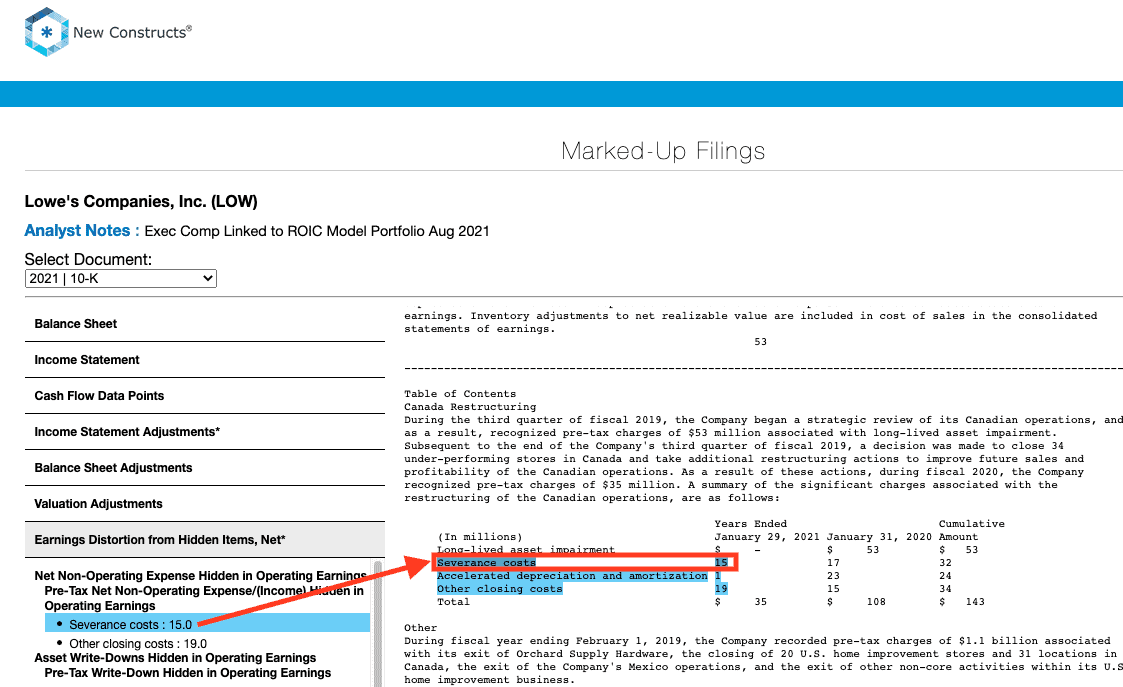
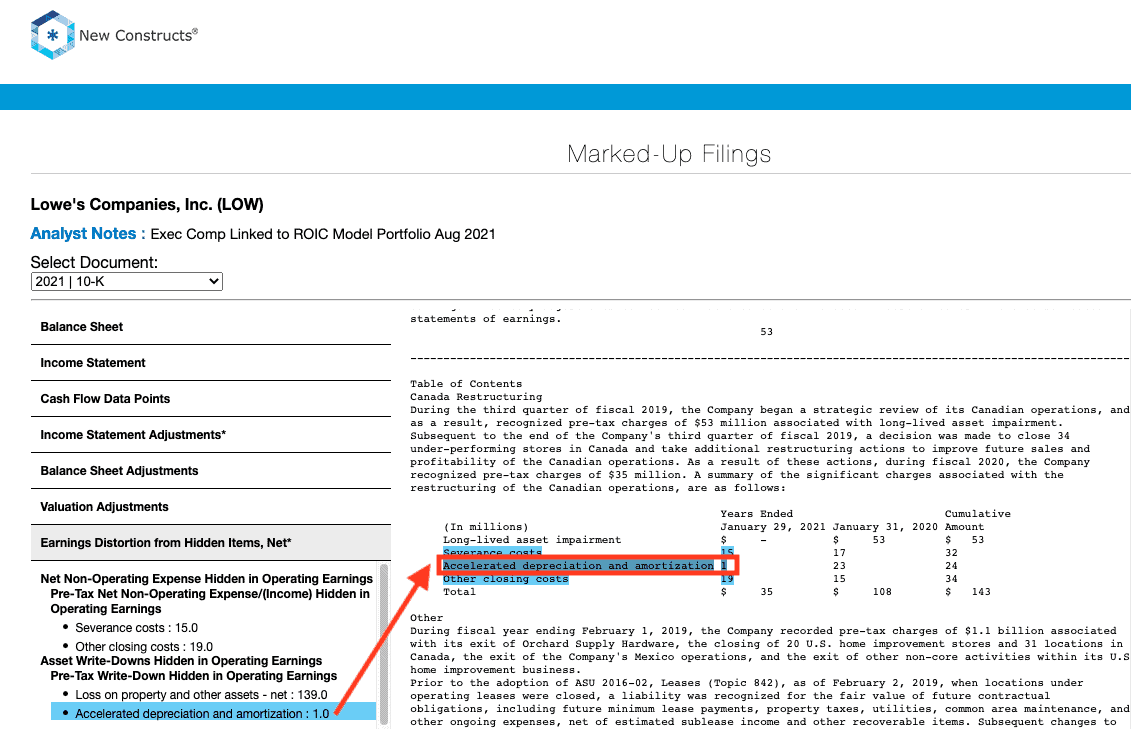
- -$26 million in restructuring charges in the TTM period, based on[4]
- -$19 million in other closing costs in 2020
- -$15 million in severance costs in 2020
- -$1 million in accelerated depreciation and amortization in 2020
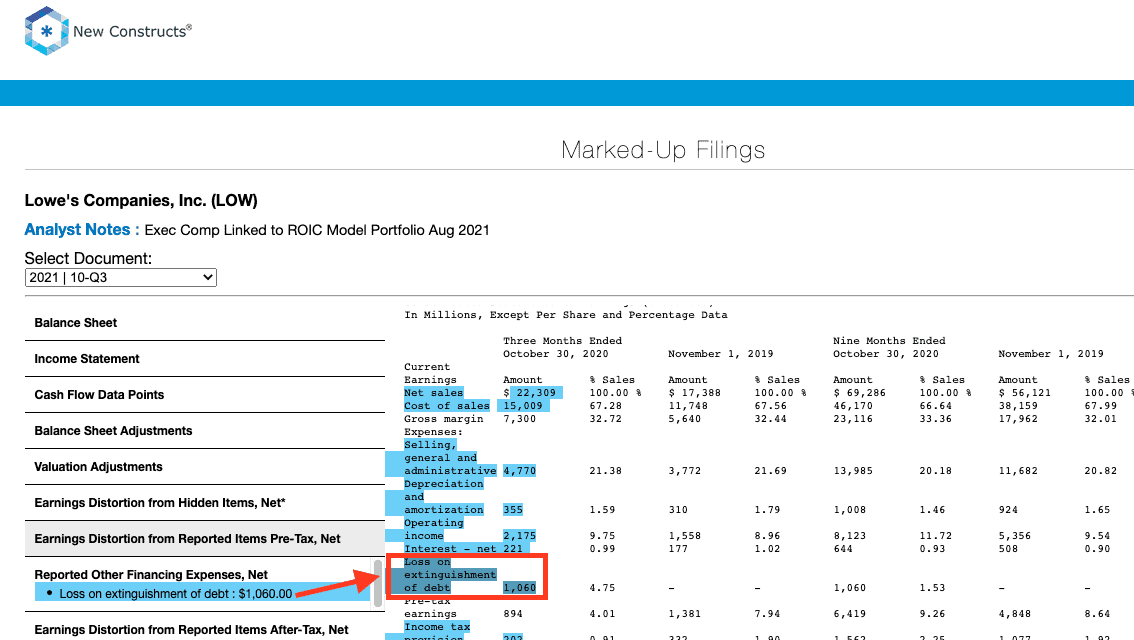
Reported Unusual Expenses Pre-Tax, Net = $-1.1 billion or -$1.43/per share
- -$1.1 billion loss on extinguishment of debt in 3Q20
Reported Unusual Expenses After-Tax, Net = -$29 million or -$0.04/per share
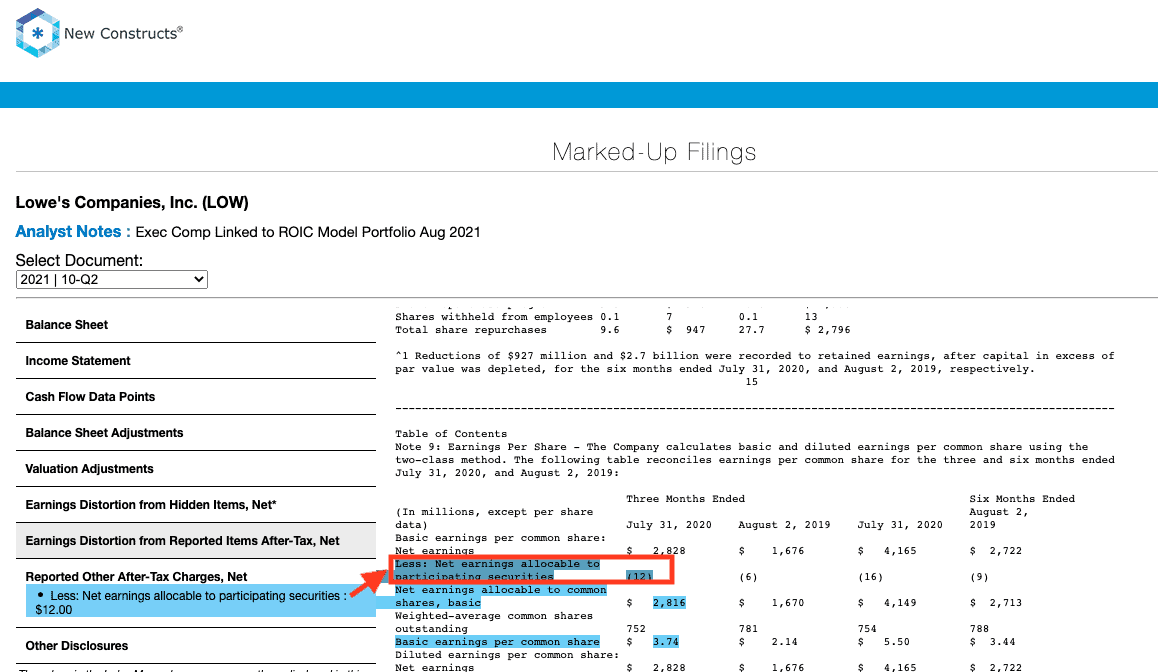
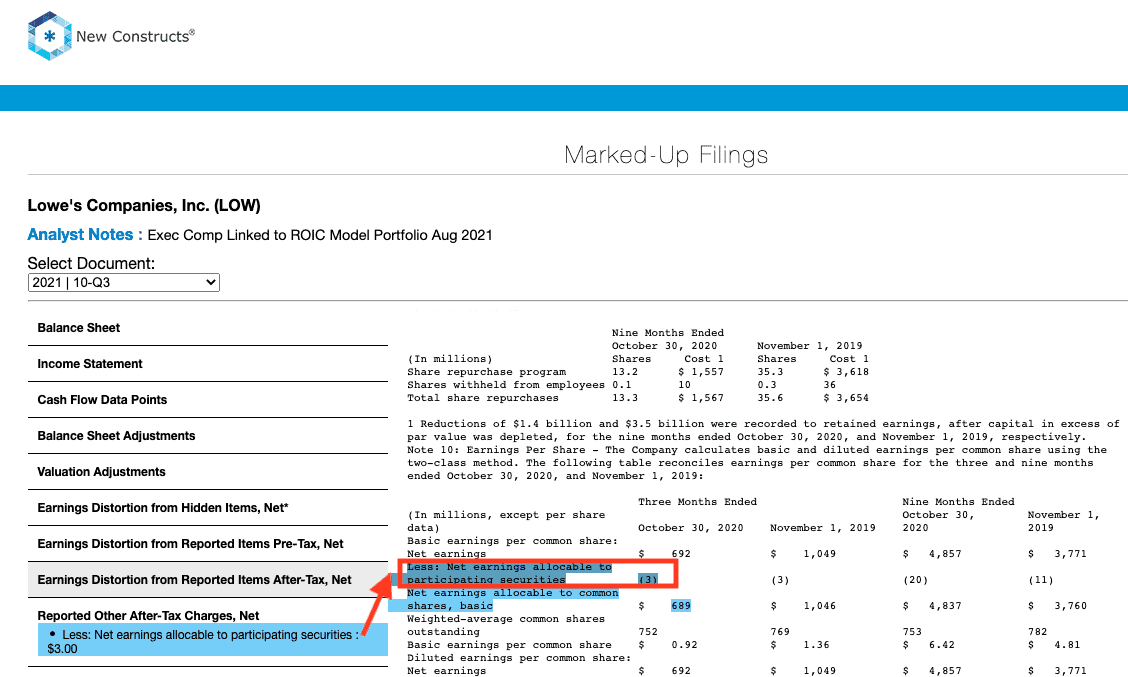
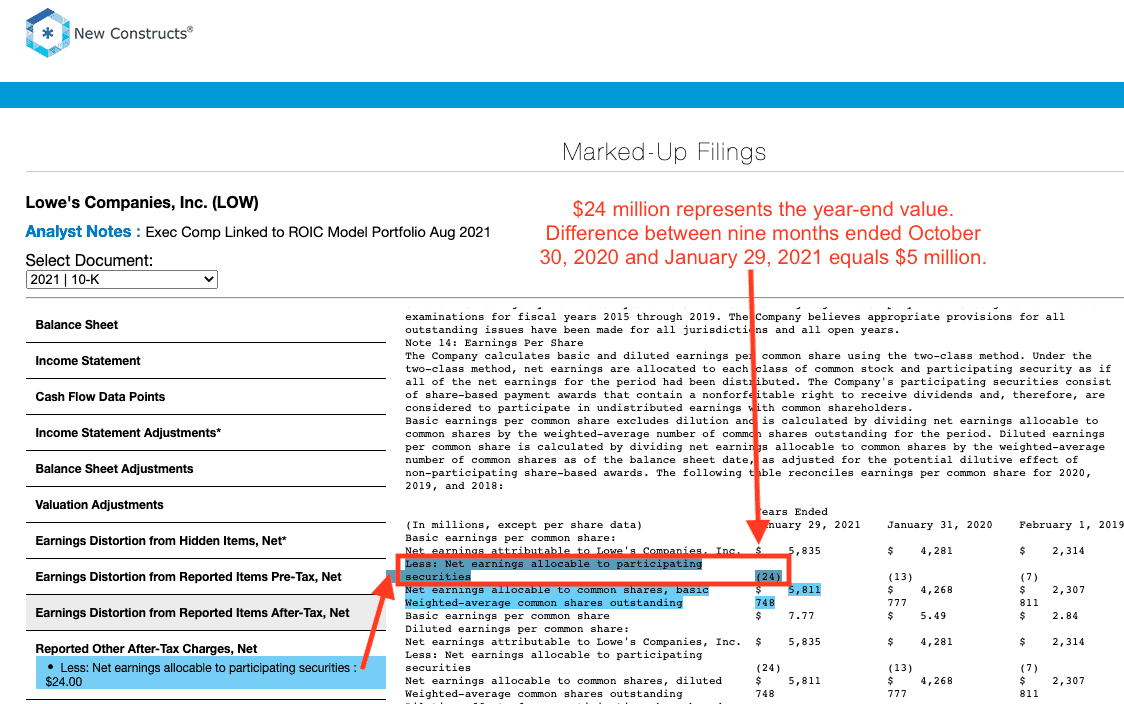
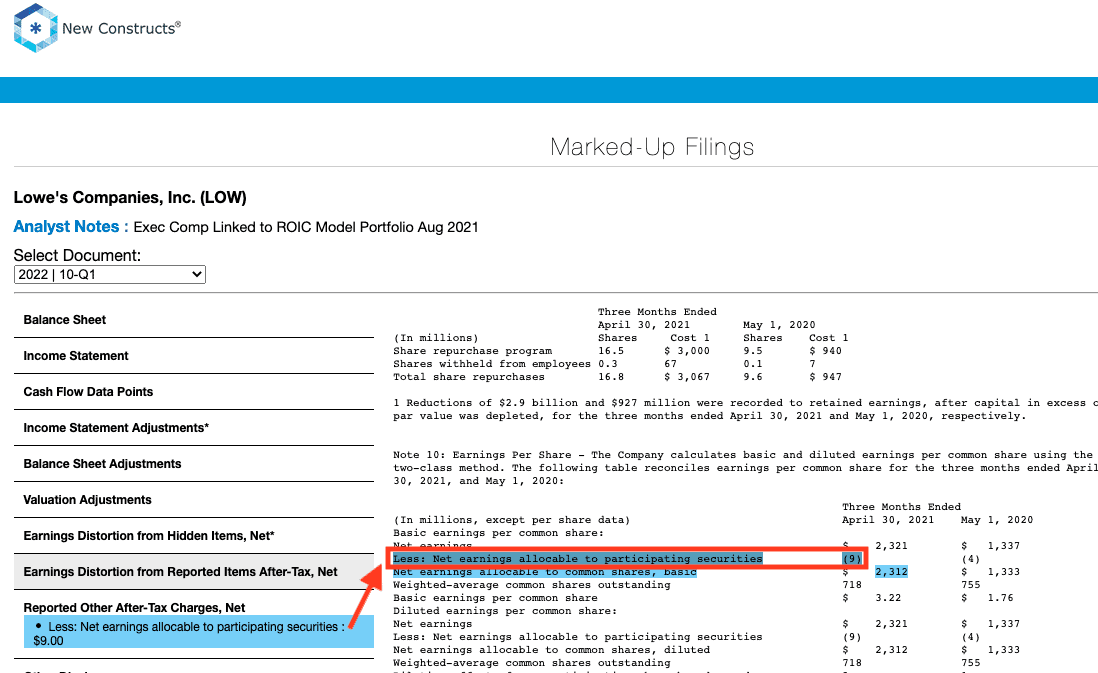
- -$29 million in net earnings allocable to participating securities in the TTM, based on
- -$12 million in 2Q20
- -$3 million in 3Q20
- -$5 million in 4Q20
- -$9 million in 1Q21
Tax Distortion = $424 million or $0.57/per share
- We remove the tax impact of unusual items on reported taxes when we calculate Core Earnings. It is important that taxes get adjusted so they are appropriate for adjusted pre-tax earnings.
This article originally published on August 25, 2021.
Disclosure: David Trainer, Kyle Guske II, Alex Sword, and Matt Shuler receive no compensation to write about any specific stock, style, or theme.
Follow us on Twitter, Facebook, LinkedIn, and StockTwits for real-time alerts on all our research.
Appendix: Calculation Methodology
We derive the Core Earnings and GAAP Earnings metrics above by summing the Trailing Twelve Month individual S&P 500 constituent values for Core Earnings and GAAP Earnings in each sector for each measurement period. We call this approach the “Aggregate” methodology.
The Aggregate methodology provides a straightforward look at the entire sector, regardless of market cap or index weighting and matches how S&P Global (SPGI) calculates metrics for the S&P 500.
[1] Only Core Earnings enable investors to overcome the inaccuracies, omissions and biases in legacy fundamental data and research, as proven in Core Earnings: New Data & Evidence, written by professors at Harvard Business School (HBS) & MIT Sloan and forthcoming in The Journal of Financial Economics.
[2] Three independent studies prove the superiority of our data, models, and ratings. Learn more here.
[3] The full version of this report provides analysis for every sector like what we show for this sector.
[4] Each of the below items was found only in the 10-K, so to calculate TTM values, we assume the charges were spread evenly throughout the four quarters in 2020.