
Check out this week’s Danger Zone interview with Chuck Jaffe of Money Life.
The financial press loves to hype up “earnings season”, but corporate earnings announcements provide investors with limited and often misleading data. The real earnings season, annual 10-K filing season, is happening right now. Investors that ignore the real earnings season and make decisions based on earnings releases and headlines are in the Danger Zone this week.
Only by reading all of the financial footnotes, which are only included in annual 10-K reports filed with the SEC, can investors know the true profits of publicly-traded companies. This report highlights the amount of information hidden in the footnotes and shows how reported earnings mislead investors about the profitability of recent Danger Zone pick Knowles Corp (KN: $15/share).
What We Find in the Filings
Every year in this six-week stretch from mid-February through the end of March, we parse and analyze roughly 2,000 10-Ks to update our models for companies with a 12/31 fiscal year end. Our analysts work tirelessly to uncover red flags hidden in the footnotes and make our models the best in the business.[1]
This level of diligence is enabled by our Robo-Analyst technology, which can read through a 200+ page 10-K in seconds to automatically collect and interpret simple data points while flagging more complex disclosures for our analysts to review. This machine learning system gets smarter with every filing it reads, allowing us to automate more of the process and make our analysts even more productive.
Figure 1 shows the amount of work we’ve completed through the first week of this year’s filing season along with the work we performed throughout the entirety of filing season 2017.
Figure 1: Filing Season Diligence
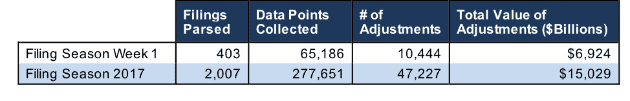
Sources: New Constructs, LLC and company filings.
During last year’s filing season, we made 47,227 adjustments with a total value of over $15 trillion. Through just one week of the 2018 filing season we’ve made 10,444 adjustments with a total value of nearly $7 trillion. We share an example of how important these adjustments can be below.
An Example of the Earnings Season Mirage
Knowles Corp (KN), which we put in the Danger Zone just last month, is a great example of a company that consistently beats earnings expectations but fails to create value for shareholders. The consumer and specialty electronics maker beat consensus expectations in all four quarters last year and 15 out of its 16 quarters as a public company. Despite those earnings beats, KN is down 22% over the past year and 51% since it began trading in 2014.
Our analysis of KN’s 2017 10-K showed why the market is not “Crazy in Love” with Knowles’ reported earnings. The company benefits from a number of a non-recurring items to inflate its reported profitability.
Most notably, the company earned an additional $13.6 million (20% of GAAP net income) in non-recurring revenue due to the settlement of a royalty dispute. This unusual item helped the company beat earning expectations by 5 cents per share in 4Q17 when it would have fallen short of expectations otherwise.
In addition, KN benefited from a $2.2 million gain due to the decrease in its inventory reserves. Notably, the company’s gross inventories increased by 28% in 2017, so KN is saying it expects fewer inventory losses even with a much larger inventory on hand. This behavior, along with the company’s track record of consistent and narrow earnings beats, suggests that it may be one of the 20% of companies that manipulates earnings.
Overall, we made the following adjustments to Knowles Corp’s 2017 10-K:
Income Statement: we made $135 million of adjustments, with a net effect of removing $25 million in non-operating income (3% of revenue). We removed $80 million in non-operating income and $55 million in non-operating expenses. You can see all the adjustments made to KN’s income statement here.
Balance Sheet: we made $700 million of adjustments to calculate invested capital with a net increase of $500 million. The most notable adjustment was $100 million in other comprehensive income. This adjustment represented 7% of reported net assets. You can see all the adjustments made to KN’s balance sheet here.
Valuation: we made $357 million of adjustments with a net effect of decreasing shareholder value by $208 million. The largest adjustment to shareholder value was $256 million in adjusted total debt, which includes $49 million in off-balance sheet debt. This adjustment represents 20% KN’s market cap.
We also found one more red flag on page 69 of KN’s 2017 10-K. The company disclosed that it had made an error in its 2016 10-K. Over $190 million of fully amortized intangible assets had their carrying values reported in the footnotes when they should have been written off entirely. This is a relatively minor error as the value on the balance sheet was still correct, but it raises more questions about the reliability of KN’s financials.
Figure 2 shows that KN earned positive GAAP net income in 2017 for the first time in its history, but the company remains far away from breaking even on an economic earnings basis.
Figure 2: KN GAAP vs. Economic Earnings Since 2014
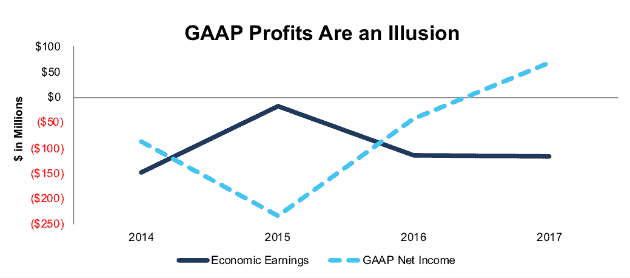
Sources: New Constructs, LLC and company filings.
The stocks poor performance over the past year and throughout its history shows that economic earnings, not reported earnings, are what truly determine long-term value. KN is down 8% since we first put it in the Danger Zone, and we expect it to continue to fall.
More to Come
KN is just one of many stocks we’ve found with red flags in the footnotes. Already this filing season we’ve found significant non-operating income hidden in the footnotes of Chesapeake Lodging Trust (CHSP) and Six Flags (SIX). Stay tuned for our daily filing season updates and check out #filingseasonfinds on Twitter to see all the red flags and unusual items we uncover.
This article originally published on February 26, 2018.
Disclosure: David Trainer, Sam McBride and Kyle Guske II receive no compensation to write about any specific stock, sector, style, or theme.
Follow us on Twitter, Facebook, LinkedIn, and StockTwits for real-time alerts on all our research.
[1] Ernst & Young’s recent white paper, “Getting ROIC Right”, proves the superiority of our research and analytics.
Click here to download a PDF of this report.
Photo Credit: Skitterphoto (Pexels)