
We closed the HST position on November 12, 2019. A copy of the associated Position Update report is here.
Check out this week’s Danger Zone interview with Chuck Jaffe of Money Life.
Despite these flaws, the P/E ratio remains a popular valuation metric. The investors that rely on P/Es expose themselves to the risk of buying “value traps” or stocks that look cheap but are actually expensive.
To help avoid these traps, we’re highlighting three stocks that appear cheap and getting cheaper based on declining P/Es. After reversing accounting distortions and analyzing the future cash flows embedded in their valuations, we see that these stocks are actually expensive and getting more expensive. Landec Corporation (LNDC: $13/share), Brooks Automation (BRKS: $30/share), and Host Hotels & Resorts (HST: $18/share) are in the Danger Zone.
How Falling P/E Creates Misleading Value
Per Figure 1, the P/E ratios of LNDC, BRKS, and HST have all fallen over the past year. On the surface, this lower P/E seems to imply the stocks are now cheaper and better values.
Not so fast – P/E ratios are misleading because:
- Accounting rules can change, shifting reported earnings without any change in the underlying business.
- The large number of accounting loopholes makes it easy for executives to mislead investors.
- They overlook assets and liabilities that have a material impact on valuation.
When we look at the price-to-economic value (PEBV) ratio, which is a better valuation metric, we find that these stocks are getting significantly more expensive. PEBV compares the current valuation of the company to its no-growth value. Unlike P/E, our PEBV adjusts for accounting loopholes[1] and changing accounting rules while also accounting for all long-term assets and liabilities that impact valuation.
Figure 1: Falling P/E Ratios Create Misleading “Value” As PEBV Rises
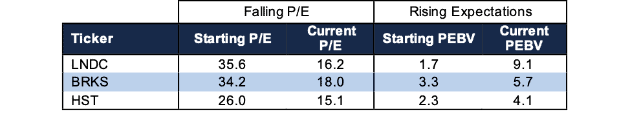
Sources: New Constructs, LLC and company filings
Each of the stocks in Figure 1 began their respective fiscal 2018 with P/Es above the S&P 500 (SPY) average of 25, but currently have P/Es below the SPY average of 20. Meanwhile, each of their PEBVs are above the market-weighted S&P 500 average PEBV ratio of 2.6.
Landec Corporation (LNDC: $13/share)
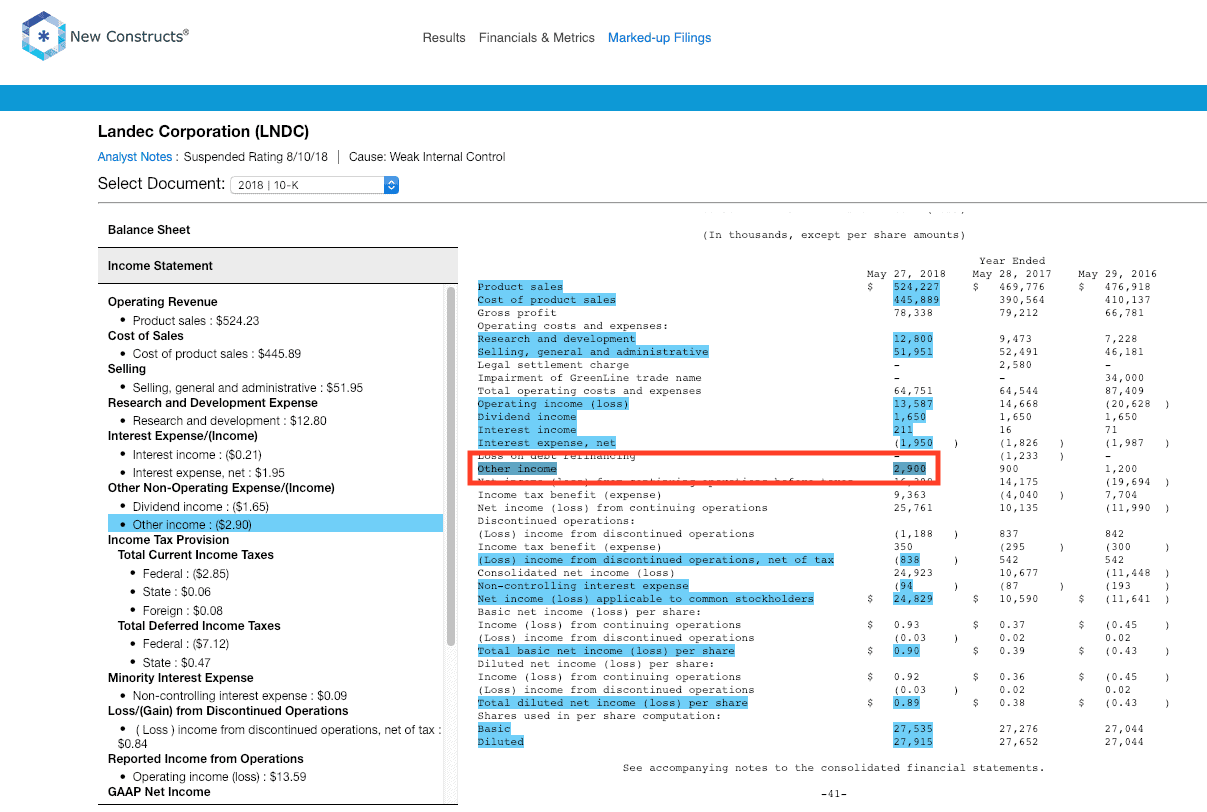
Landec Corporation, a producer of packaged fresh vegetables, had artificially inflated earnings in fiscal 2018 and the trailing twelve-month (TTM) period ending November 25, 2018. Inflated earnings artificially lower its P/E and create an illusion of value during that time, per Figure 2.
Figure 2: LNDC’s Falling P/E & Rising PEBV
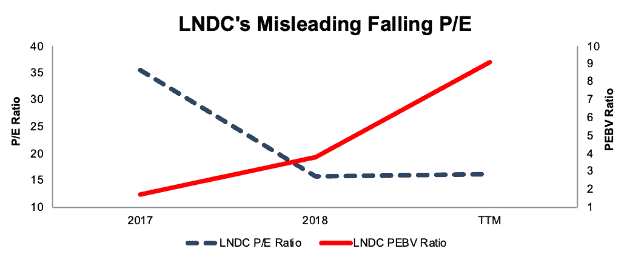
Sources: New Constructs, LLC and company filings
Why Earnings Are Misleading: In fiscal 2018, GAAP net income grew by 134% year-over-year (YoY) while NOPAT fell 33%. TTM GAAP net income, despite being down from fiscal 2018 levels, is still more than double the prior TTM period, while TTM NOPAT is down 25% over the same time.
Figure 3: LNDC’s Misleading GAAP Earnings Rise Obscures Falling NOPAT
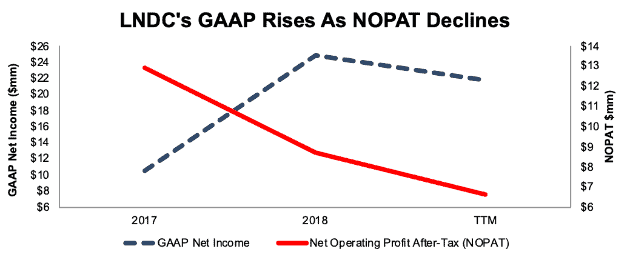
Sources: New Constructs, LLC and company filings
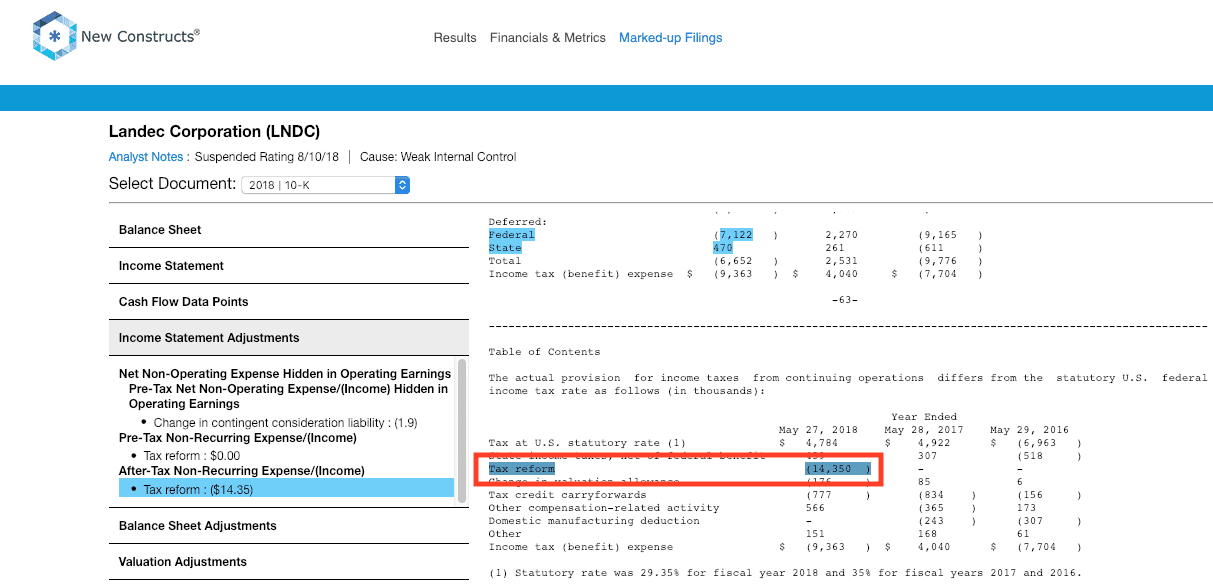
This disconnect between GAAP and NOPAT comes primarily from a $14.4 million tax benefit (58% of fiscal 2018 GAAP net income). In addition, GAAP is artificially increased due to $1.9 million in hidden non-operating income due to a change in contingent liabilities and $2.9 million in other income reported directly on the income statement. These large non-operating items help boost earnings and drive down LNDC’s P/E ratio.
In addition, LNDC still has $17.7 million in deferred tax liabilities on its balance sheet. It also has $3.7 million in outstanding employee stock options. Together, these liabilities represent more than $21 million (6% of market cap) in senior claims on future cash flows that are not accounted for by the P/E ratio.
Why Valuation is Expensive: As a result of our adjustments, we see that LNDC’s economic book value per share fell from $8.29 at the end of fiscal 2017 to $3.68 in fiscal 2018, and even further, to $1.38 TTM as of November 25, 2018. This falling EBV drove LNDC’s PEBV ratio from a reasonable 1.7 to a Very Unattractive 9.1 as of January 31, 2019.
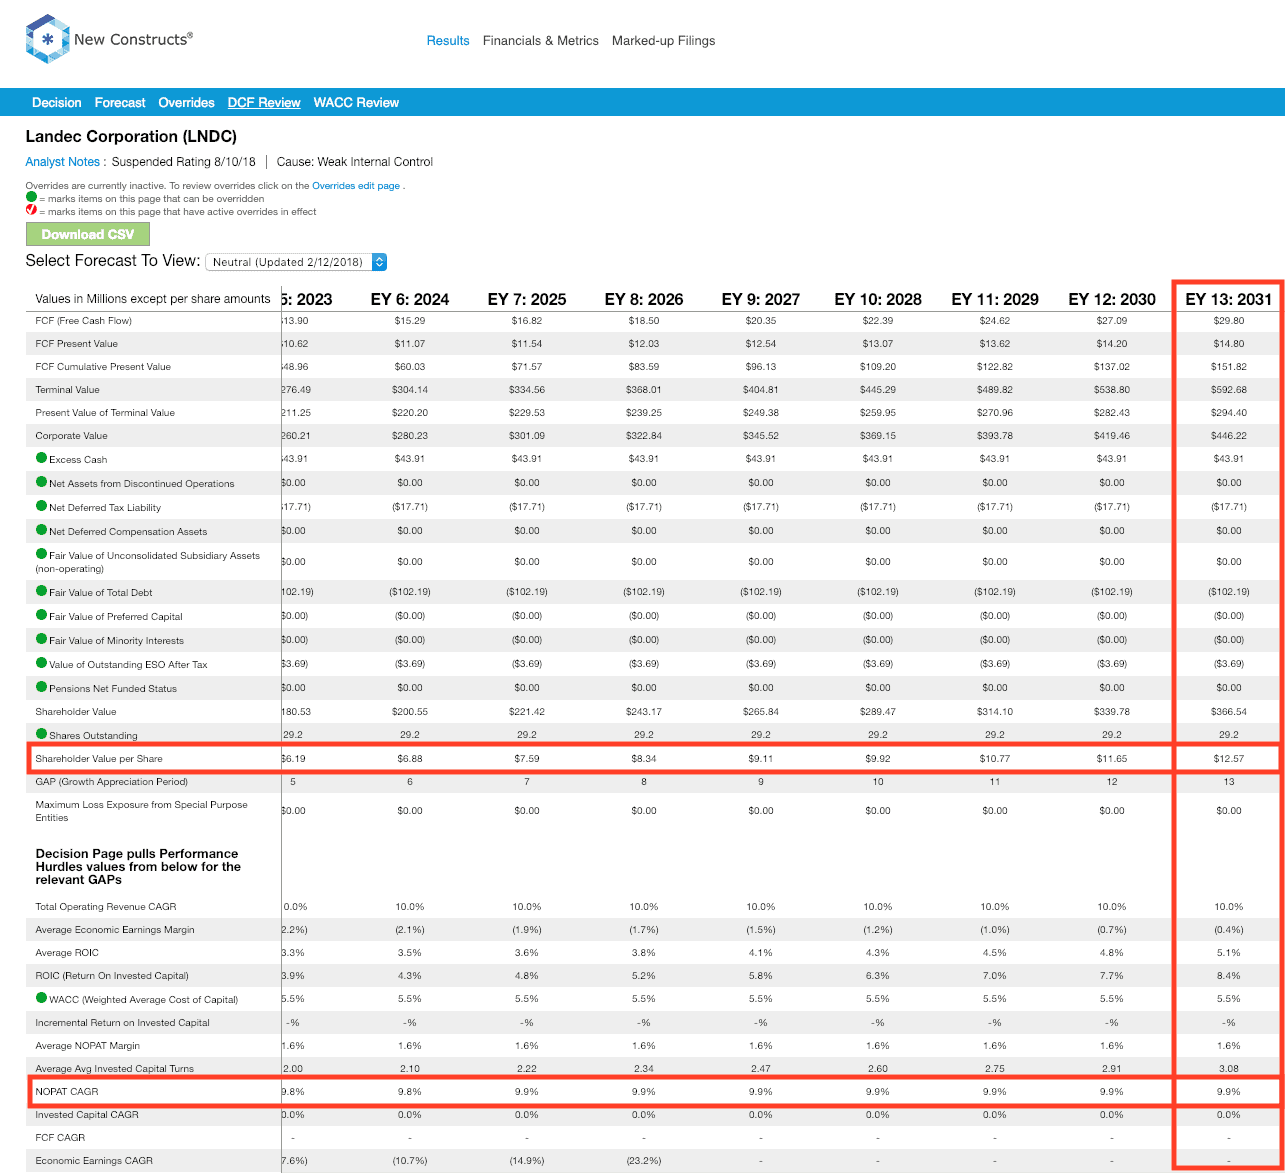
To fulfill the growth expectations baked into its current stock price of ~$13/share, LNDC must achieve 2% NOPAT margins (equal to fiscal 2018, compared to 1% TTM) and grow NOPAT by 10% compounded annually for the next 13 years. See the math behind this dynamic DCF scenario. For reference, LNDC’s NOPAT has fallen by 9% compounded annually over the past five years and 4% compounded annually over the past decade.
If LNDC were valued at the SPY average PEBV of 2.6, it would be worth just $4/share, 72% below the current stock price.
Compounding the above issues, LNDC received a weak internal control opinion from its auditor, Ernst & Young, when it filed its fiscal 2018 10-K. Such an opinion raises the risks of investing in LNDC. We provide more details on weak internal controls here.
Brooks Automation (BRKS: $30/share)
Brooks Automation, a semiconductor and life sciences equipment manufacturer, may appear cheap on a P/E basis, but earns our Very Unattractive rating and a spot in January’s Most Dangerous Stocks Model Portfolio.
Figure 4: BRKS’ Falling P/E & Rising PEBV
Sources: New Constructs, LLC and company filings
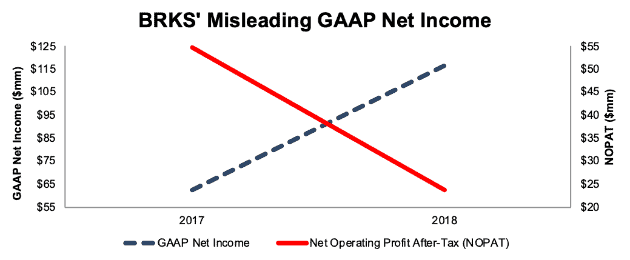
Why Earnings Are Misleading: BRKS’ fiscal 2018 GAAP net income grew by 86% YoY while NOPAT fell 56% YoY, per Figure 5.
Figure 5: BRKS GAAP Net Income Masks Declining Profits
Sources: New Constructs, LLC and company filings
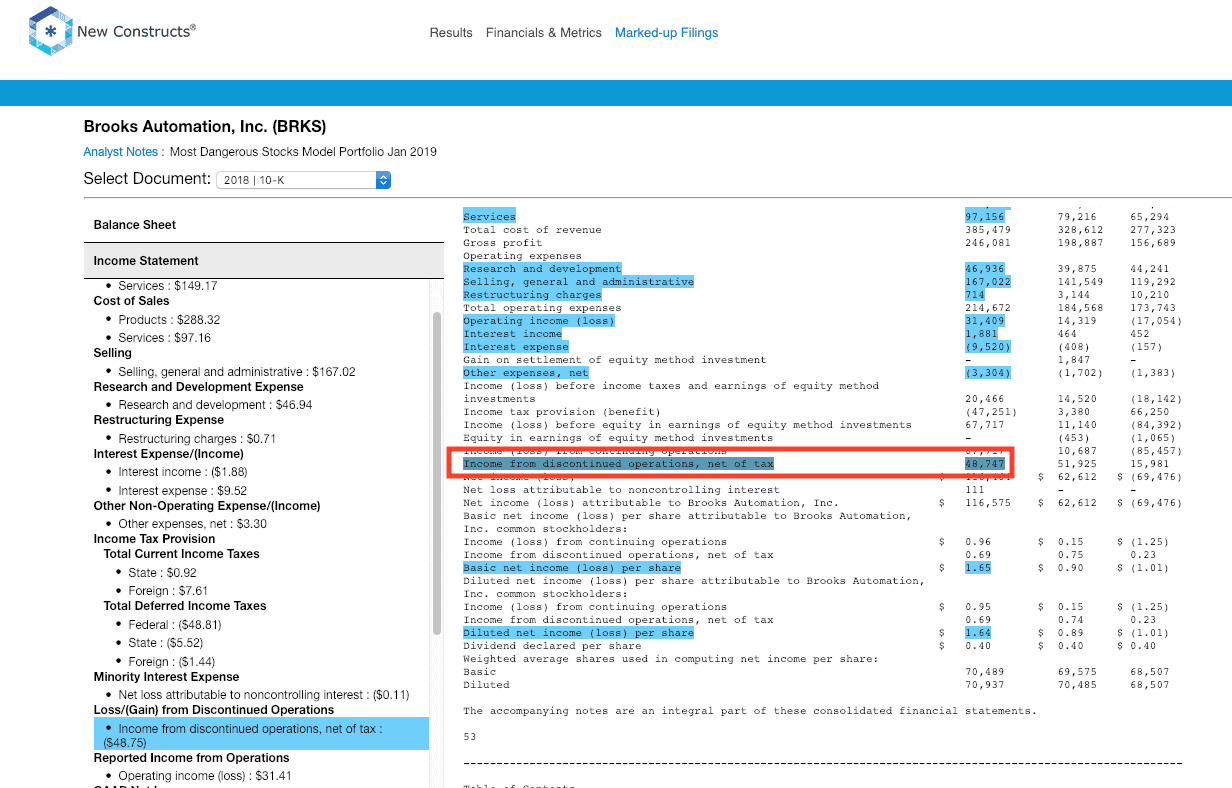
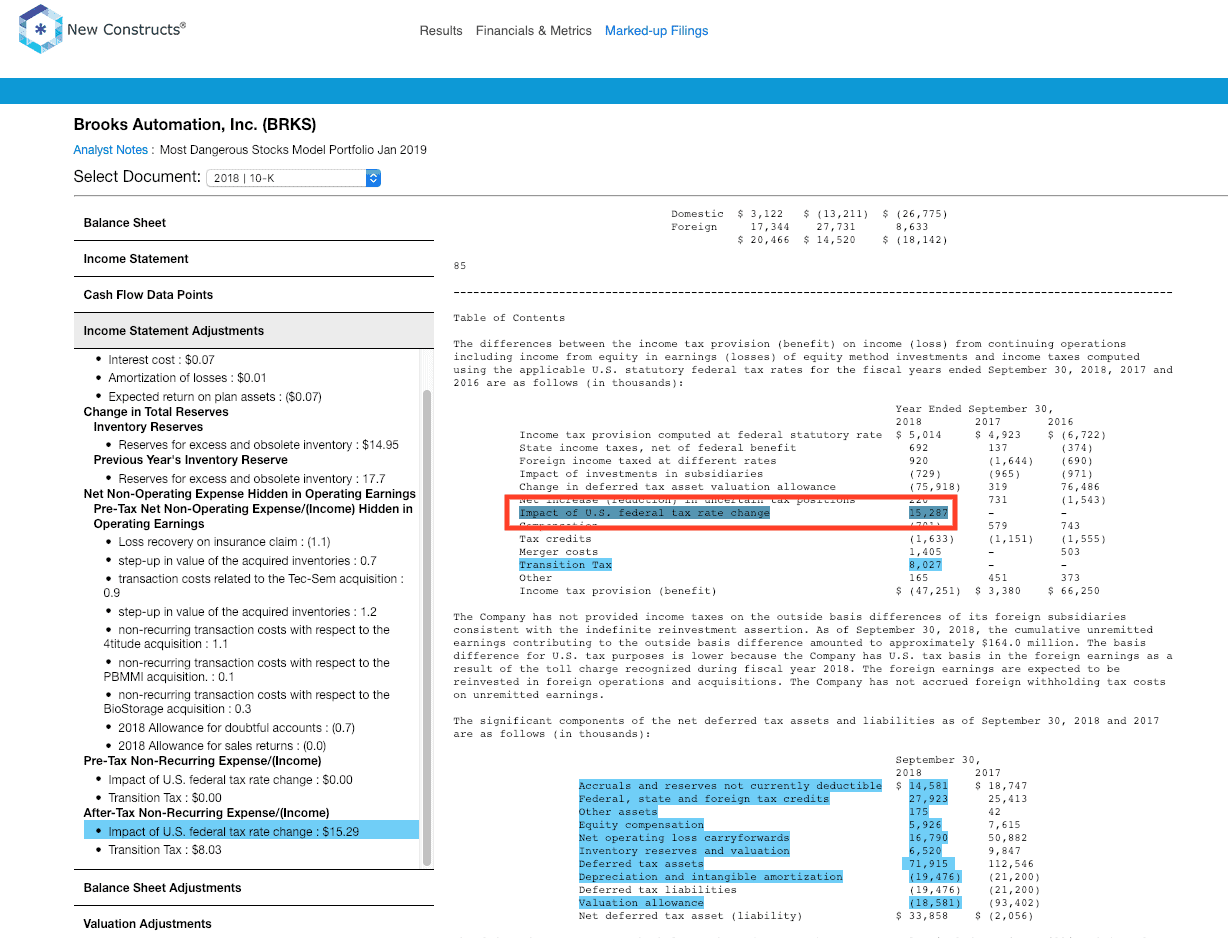
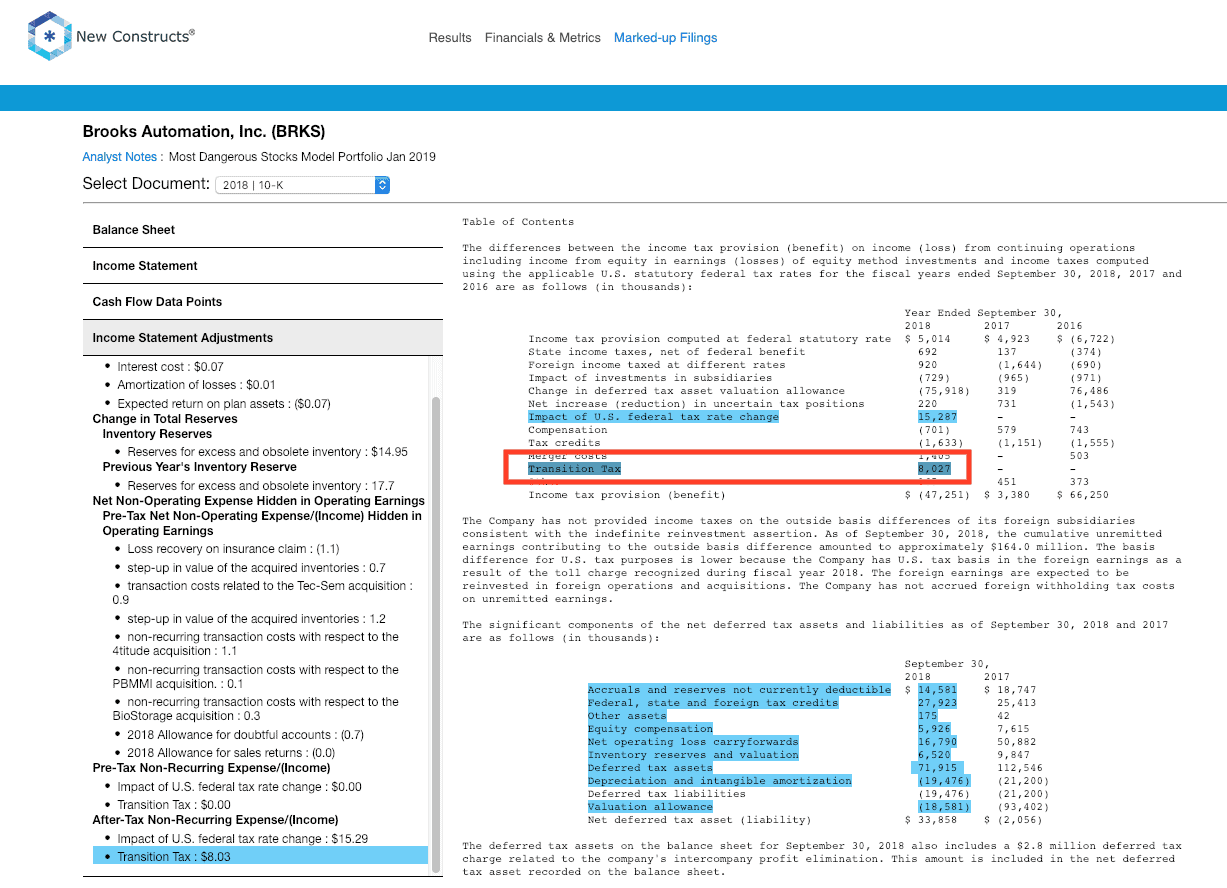
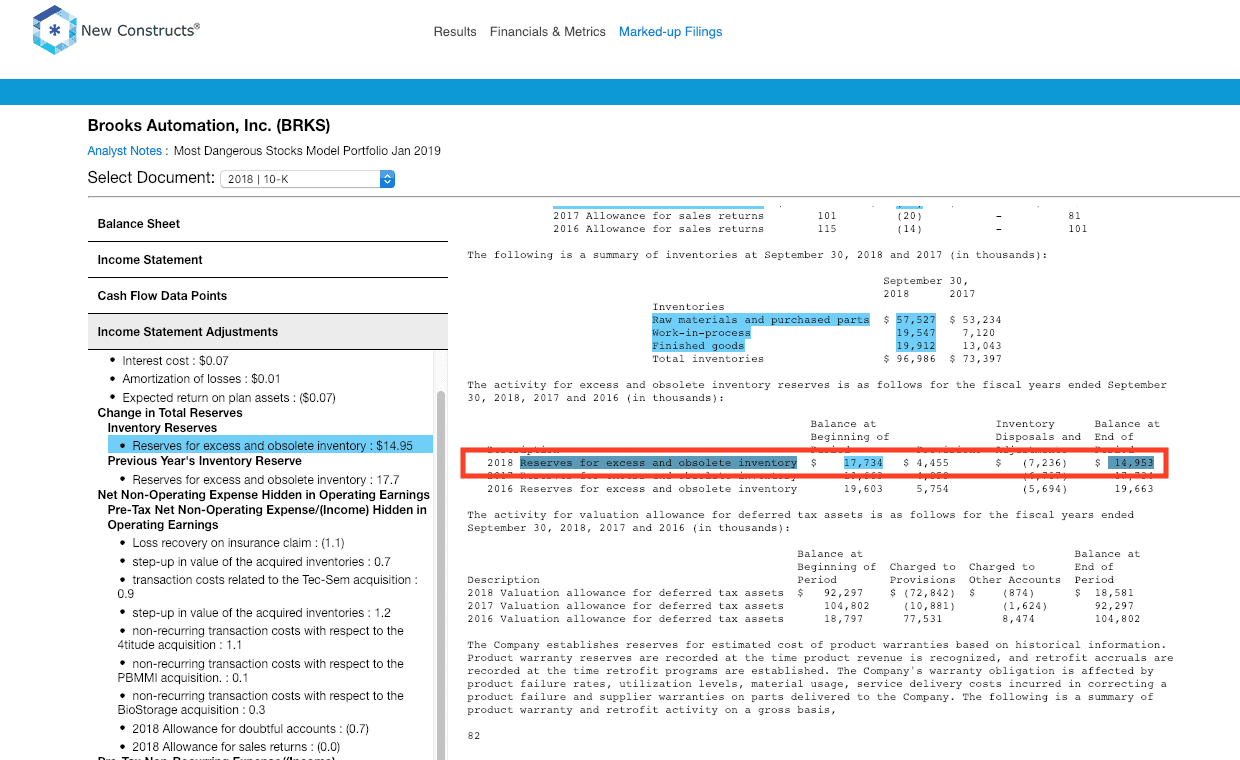
This disconnect between GAAP and NOPAT comes primarily from $49 million in non-operating income from discontinued operations (42% of GAAP net income). We also removed $15.3 million due to tax reform, $8 million in transition tax, and $2.8 million in income from a change in reserves. Without making these adjustments, investors are led to believe BRKS’s earnings are significantly improved over fiscal 2017, and its P/E ratio has nearly halved as a result.
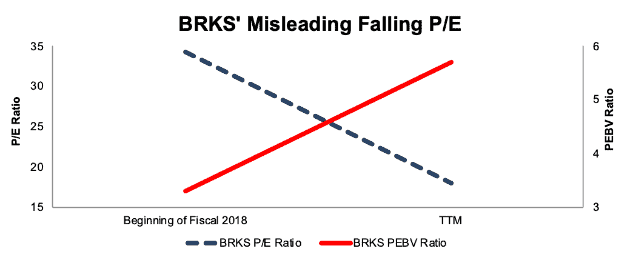
Why Valuation is Expensive: Declining NOPAT plus rising total debt and $4 million in underfunded pensions drive BRKS’ economic book value per share down from $9.12 in fiscal 2017 to $5.32 in fiscal 2018. Such a deterioration, without a subsequent decline in valuation led BRKS’s PEBV to rise from 3.3 in fiscal 2017 to 5.7 as of January 31, 2019. What appears cheap based on a falling P/E ratio is actually much more expensive than the market average.
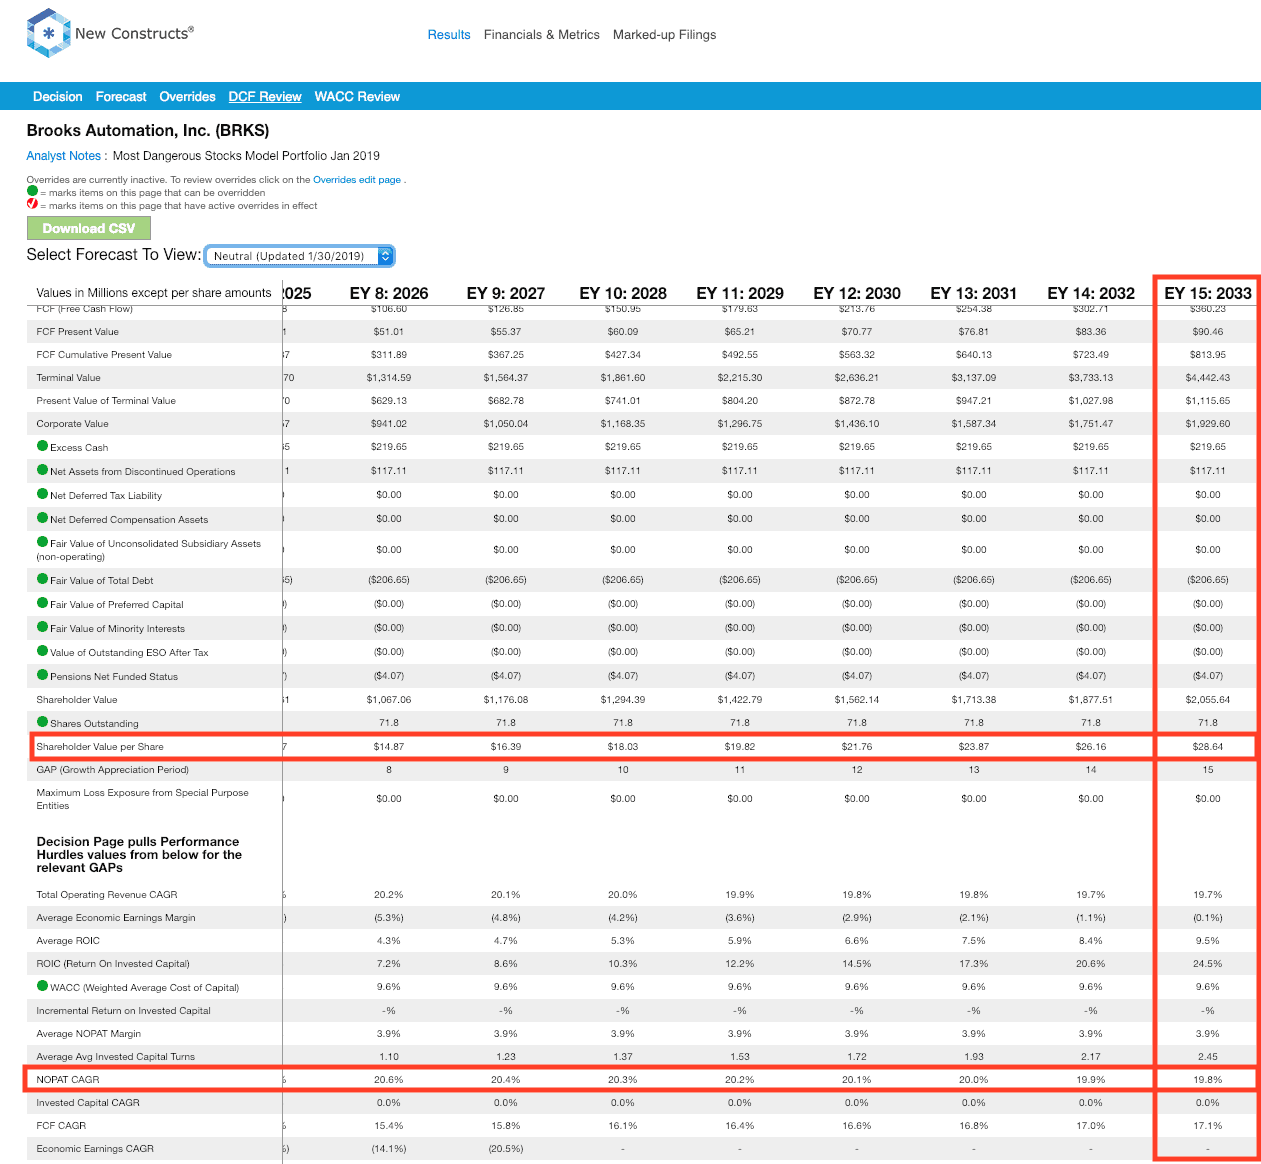
Now, to justify its current price of ~$30/share, BRKS must maintain fiscal 2018 margins and grow NOPAT by 20% compounded annually for the next 15 years. See the math behind this dynamic DCF scenario. Such expectations seem optimistic for a firm whose fiscal 2018 NOPAT is half what is was in fiscal 2010 and down 56% from fiscal 2017.
If BRKS were valued at the S&P average PEBV of 2.6, it would be worth just $14/share, a 55% downside from the current price.
Host Hotels & Resorts (HST: $18/share)
Host Hotels & Resorts, a REIT that owns luxury and upscale hotels, is a perfect example of how unusual gains/losses reported on the income statement artificially increase earnings and make P/E ratios look cheap.
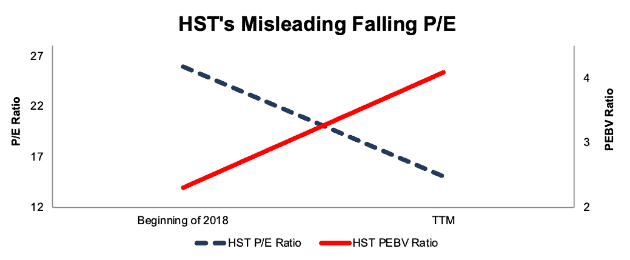
Figure 6: HST’s Falling P/E & Rising PEBV
Sources: New Constructs, LLC and company filings
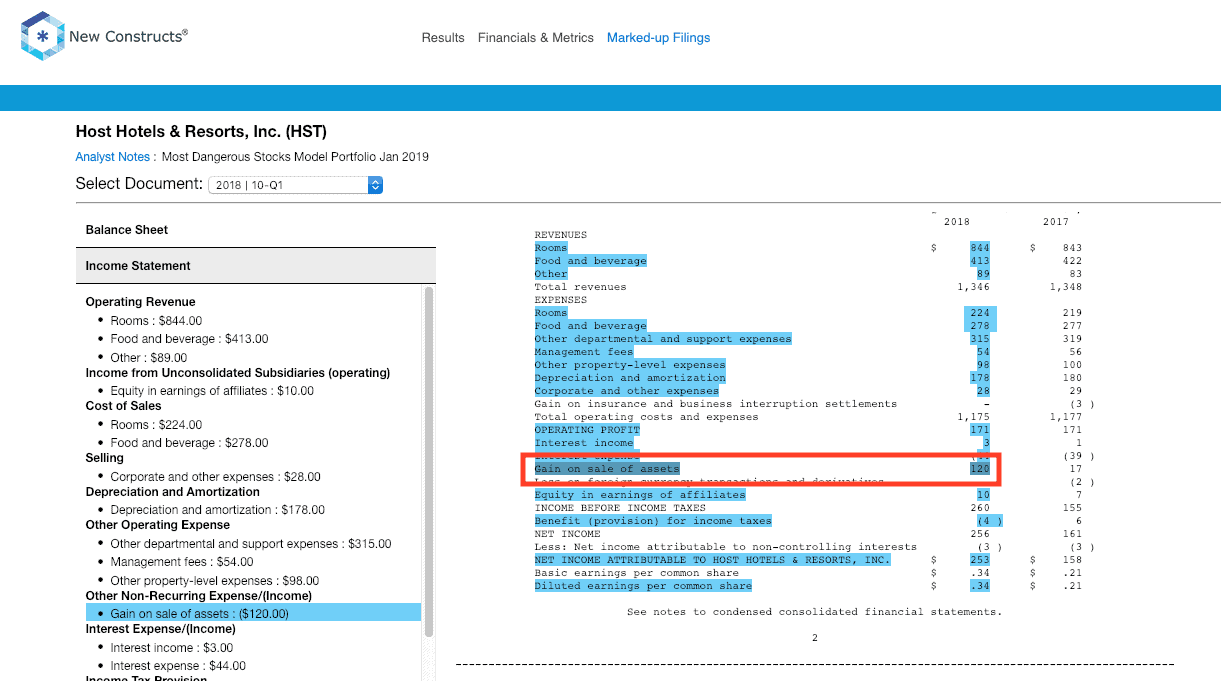
Why Earnings Are Misleading: HST’s 2017 GAAP net income was artificially reduced due to over $119 million in reported non-operating expenses. Over the subsequent TTM, GAAP net income is artificially increased due to multiple non-operating items such as:
- $120 million gain on sale in 1Q18
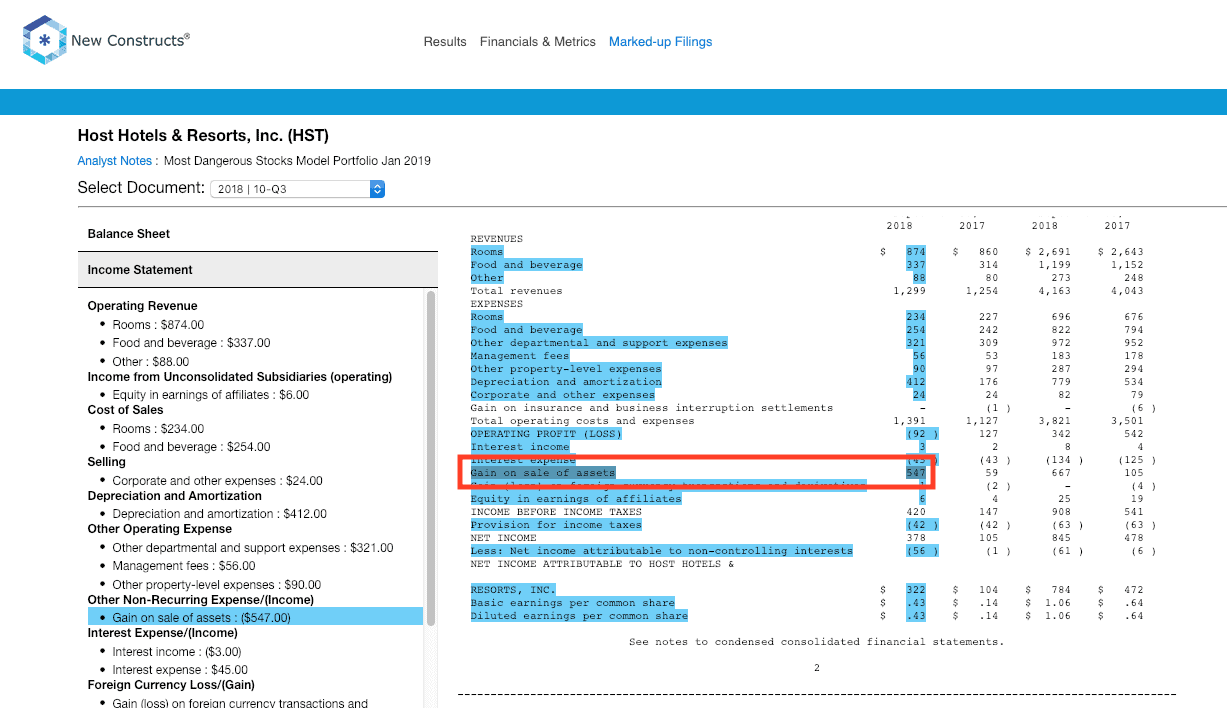
- $547 million gain on sale in 3Q18
Unlike the companies above where most of our adjustments come from footnotes, the unusual gains/losses for HST are on the income statement and should be easy for other research and data providers to identify and remediate. However, popular sites such as Yahoo Finance and GuruFocus still report the misleadingly low P/E.
Figure 7: HST’s GAAP Net Income Heads Opposite of NOPAT
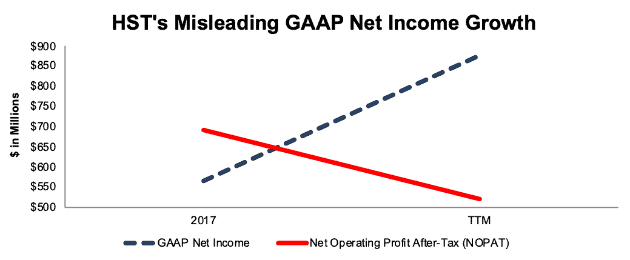
Sources: New Constructs, LLC and company filings
Why Valuation is Expensive: When you add $243 million in minority interests and $2 million in outstanding employee stock options to already falling NOPAT, you see that HST’s EBV per share fell from $8.56 in 2017 to $4.31 TTM as of September 30, 2018. Meanwhile, PEBV has risen from 2.3 in 2017 to 4.2 as of January 31, 2019.
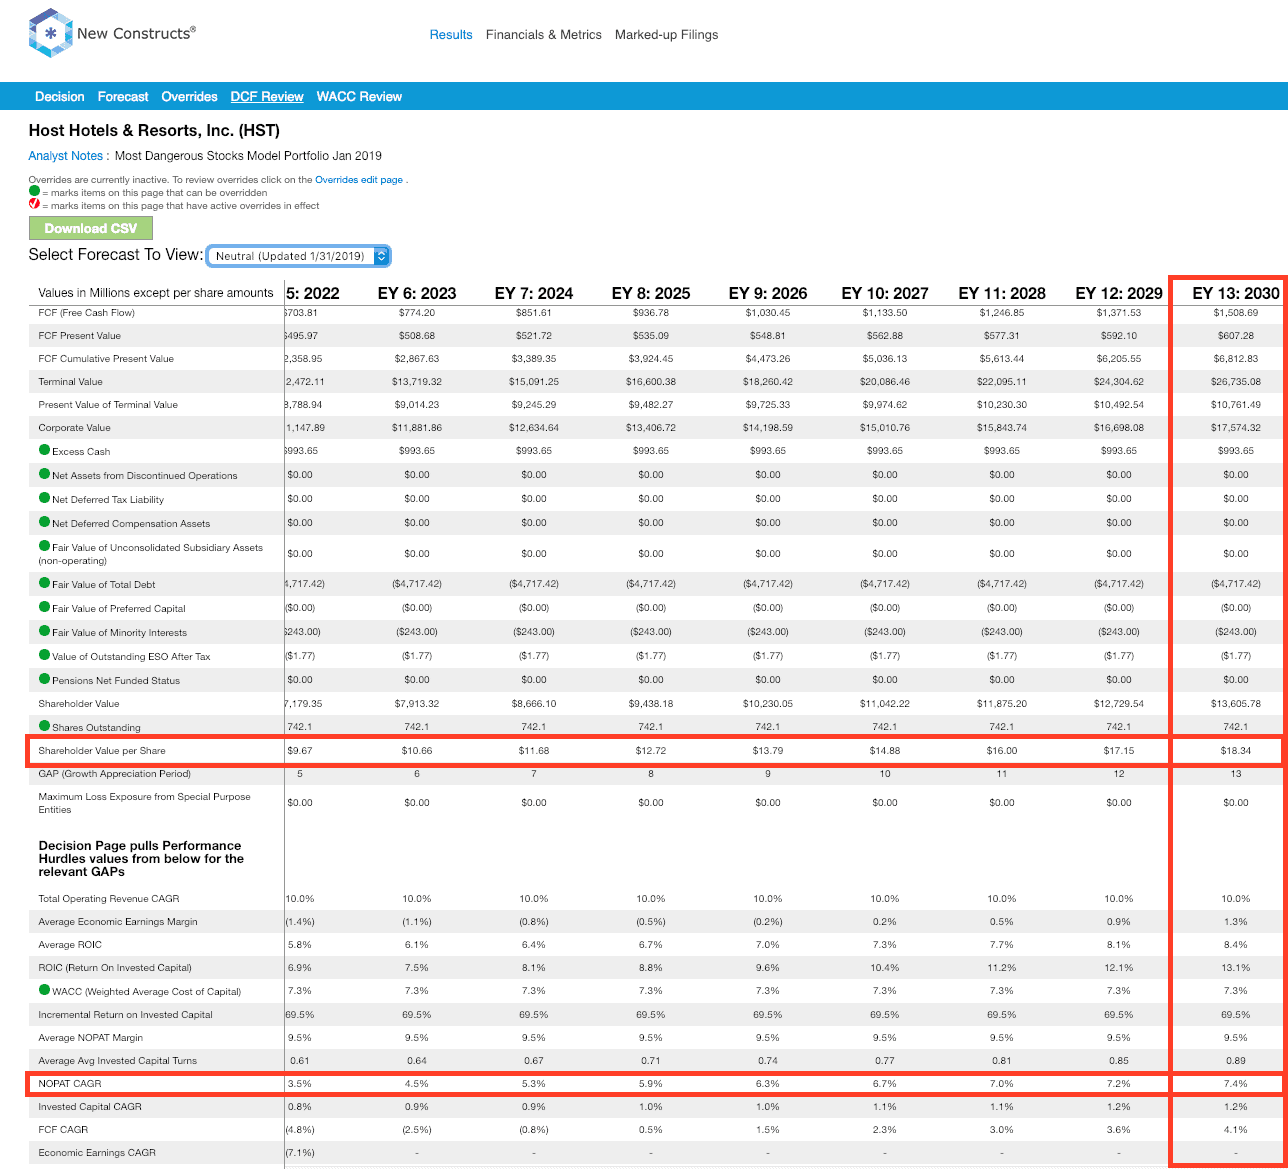
To justify its current price of $18/share, it must achieve 2017 NOPAT margins (13%, compared to 9% TTM) and grow NOPAT by 7% compounded annually for the next 13 years. See the math behind this dynamic DCF scenario. Such expectations seem optimistic for a firm whose TTM NOPAT is flat compared to 2013 and down 22% over the prior TTM period.
If HST were valued at the S&P average PEBV of 2.6, it would be worth just $11/share, a 37% downside from the current price.
This article originally published on February 5, 2019.
Disclosure: David Trainer, Kyle Guske II, and Sam McBride receive no compensation to write about any specific stock, style, or theme.
Follow us on Twitter, Facebook, LinkedIn, and StockTwits for real-time alerts on all our research.
[1] Harvard Business School features the powerful impact of our research automation technology in the case New Constructs: Disrupting Fundamental Analysis with Robo-Analysts.