
Check out this week’s Danger Zone interview with Chuck Jaffe of Money Life.
For the past few years, analysts have noted the underperformance of “value” stocks when compared to “growth” stocks. This extended underperformance has led to a large number of people, such as famous value investor Jeremy Grantham, to suggest that the traditional rules of value investing don’t work anymore.
Value investing does work, it’s just that the traditional value metrics are flawed. Most notably, the P/E ratio has serious issues that make it unreliable. The three main flaws, which we’ve discussed before are:
- Accounting rules can change, shifting reported earnings without any change in the underlying business.
- The large number of accounting loopholes makes it easy for executives to mislead investors.
- P/E ratios overlook assets and liabilities that have a material impact on valuation.
These flaws are especially magnified right now, as the impact of the new tax law is severely distorting earnings as companies revalue their deferred tax assets and liabilities. This week, we highlight three companies that look cheap based on P/E ratios but actually have significant growth expectations implied by their valuations. Duke Realty Corp (DRE: $25/share), Hilton Worldwide Holdings (HLT: $79/share), and Public Service Enterprise Group (PEG: $48/share) are in the Danger Zone.
Better Ways to Measure Value
A better measure of value is price to economic book (PEBV), which compares the current valuation of the company to its no-growth value. Unlike P/E, PEBV makes adjustments for accounting loopholes[1] and changing accounting rules and it accounts for all long-term assets and liabilities that impact valuation.
Economic book value is calculated as net operating profit after-tax (NOPAT) divided by weighted average cost of capital (WACC) plus valuation adjustments for long-term non-operating assets and liabilities (such as excess cash, total debt, underfunded pensions, etc.). Figure 1 shows how we calculate PEBV for DRE, HLT, and PEG.
Figure 1: PEBV Calculation for DRE, HLT, and PEG
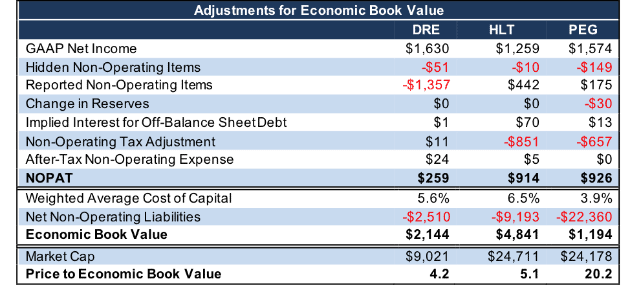
Sources: New Constructs, LLC and company filings
In addition to these adjustments, PEBV is much more intuitive to understand than P/E. If a company has a P/E of 25, what does that mean exactly? Without context, it’s hard to know if that’s a good or bad number. PEBV, on the other hand, concretely expresses the growth expectations implied in the stock price. If a company has a PEBV of 1, the market expects zero growth. If it gets higher, the market is projecting more growth, if it goes below one, the market expects profits to decline. As Figure 2 shows, PEG, HLT, and DRE all have P/E ratios below the S&P 500 (SPY) average of 23.9, but their PEBVs are above the market-weighted average of 3.1.
Figure 2: Low P/E but More Expensive Based on PEBV

Sources: New Constructs, LLC and company filings
Duke Realty Corp (DRE: $25/share)
Duke Realty, a commercial REIT, had significantly misleading earnings in 2017. GAAP net income grew by 425% while NOPAT fell by 6%.
This disconnect comes primarily from a $1.4 billion gain on sale (84% of GAAP net income) included in income from discontinued operations. This large one-time gain explains DRE’s unusually low P/E of just 5.6.
Unlike with the companies below, this unusual item shows up directly on the income statement and is easy for investors to identify and adjust. However, popular sites such as Yahoo Finance and GuruFocus still report the misleading P/E.
Once we strip out the income from discontinued operations and make the other adjustments detailed in Figure 1, we see that DRE is slightly more expensive than the market. To fulfill the growth expectations implied by its valuation of ~$25/share, DRE must grow NOPAT by 6% compounded annually for 19 years. For comparison, DRE has grown NOPAT by just 2% compounded annually over the past 19 years.
If DRE was valued at the SPY average PEBV of 3.1, it would be worth just $18/share, 30% below the current stock price.
Hilton Worldwide Holdings (HLT: $79/share)
Hilton Worldwide, a multinational hospitality company, is a prime example of a company with a misleading P/E ratio due to the impact of tax reform. HLT gets an added boost from tax reform due to its deferred tax liabilities, a topic we covered in a recent article.
Companies with deferred tax liabilities get a double bonus from tax cuts. In addition to paying the lower rate on future earnings, they get to decrease their deferred tax liability on the balance sheet, which shows up as a one-time tax benefit on the income statement. Tax reform gave HLT a $665 million tax benefit (53% of GAAP net income) in 2017. After accounting for all income statement adjustments, HLT’s NOPAT of $914 million was 27% below its GAAP net income.
Even after the impact of tax reform, HLT still has $950 million in deferred tax liabilities on its balance sheet. It also has $156 million in underfunded pensions and $41 million in outstanding employee stock options. Together, these liabilities represent more than $1.1 billion (5% of market cap) in senior claims on future cash flows that are not accounted for by the P/E ratio.
As a result of our adjustments, we show that HLT’s PEBV of 5.1 implies significantly higher growth than the market as a whole. More specifically, to justify its current price of ~$79/share, HLT must grow NOPAT by 12% compounded annually for nine years. Those are optimistic expectations for a company that has only grown NOPAT by 3% compounded annually in the five years since its IPO.
If HLT were valued at the S&P average PEBV of 3.1, it would be worth just $47/share, about a 40% downside from the current price.
Public Service Enterprise Group (PEG: $48/share)
Public Service Enterprise Group, a power and utility company that serves New England and the Mid-Atlantic region, has a wide array of adjustments that make its cheap-looking P/E of 15.4 misleading. The biggest adjustment, like HLT, is a $755 million (48% of GAAP net income) one-time benefit from tax reform.
However, PEG also earns significant non-operating income from other hidden items, including:
- $107 million from changes in regulatory assets and liabilities
- $30 million from changes in reserves
- $42 million from non-operating pension gains
Combined, these items add up to an additional $179 million (11% of GAAP net income) in non-operating income that should be removed from NOPAT. Add in $5.2 billion in deferred tax liabilities and $2.7 billion in underfunded pensions, and it’s clear why the company’s P/E ratio is so misleading.
For PEG to justify its valuation of ~$48/share, it must grow NOPAT by 7% compounded annually for 11 years. Those are high expectations for a company whose 2017 NOPAT was 34% below its profits from 11 years earlier.
If PEG was valued at a PEBV in-line with the S&P 500, it would be worth just $7/share, 85% below the current stock price. Due to the value of its assets on the balance sheet, it’s unlikely that PEG would fall so far, but its low economic book value shows just how expensive the stock is today.
This article originally published on March 26, 2018.
Disclosure: David Trainer, Sam McBride, and Kyle Guske II receive no compensation to write about any specific stock, style, or theme.
Follow us on Twitter, Facebook, LinkedIn, and StockTwits for real-time alerts on all our research.
[1] Harvard Business School features the powerful impact of our research automation technology in the case New Constructs: Disrupting Fundamental Analysis with Robo-Analysts.
Click here to download a PDF of this report.
Photo Credit: TheDigitalArtist (Pixabay)