
12 new stocks make our Dividend Growth Stocks Model Portfolio this month, which was made available to members on January 29, 2020.
Recap from December’s Picks
Our Dividend Growth Stocks Model Portfolio underperformed the S&P 500 from December 27, 2019 through January 27, 2020. The Model Portfolio fell 3.4% on a price return basis and fell 3.0% on a total return basis. The S&P 500 rose 0.2% on a price return and total return basis. The portfolio’s best performing stock was up 9.4%. Overall, nine out of the 25 Dividend Growth Stocks outperformed the S&P from December 27, 2019 through January 27, 2020.
Only our research utilizes the superior data and earnings adjustments featured by the HBS & MIT Sloan paper, "Core Earnings: New Data and Evidence.” The long-term success of our model portfolio strategies highlights the value of our Robo-Analyst technology[1], which scales our forensic accounting expertise (featured in Barron’s) across thousands of stocks[2].
The methodology for this model portfolio mimics an All-Cap Blend style with a focus on dividend growth. Selected stocks earn an Attractive or Very Attractive rating, generate positive free cash flow (FCF) and economic earnings, offer a current dividend yield >1%, and have a 5+ year track record of consecutive dividend growth. This model portfolio is designed for investors who are more focused on long-term capital appreciation than current income, but still appreciate the power of dividends, especially growing dividends.
Featured Stock from January: Ameriprise Financial, Inc. (AMP: $173/share)
Ameriprise Financial, Inc. (AMP) is the featured stock from January’s Dividend Growth Stocks Model Portfolio.
Since 2016, AMP has grown revenue by 5% compounded annually and after-tax profit (NOPAT) by 26% compounded annually. Longer-term, AMP has grown NOPAT by 12% compounded annually since 2009. AMP’s profit growth is driven by NOPAT margins rising from 11% in 2016 to 15% TTM while its return on invested capital (ROIC) improved from 10% to 18% over the same time.
Figure 1: AMP’s Revenue & NOPAT Since 2016
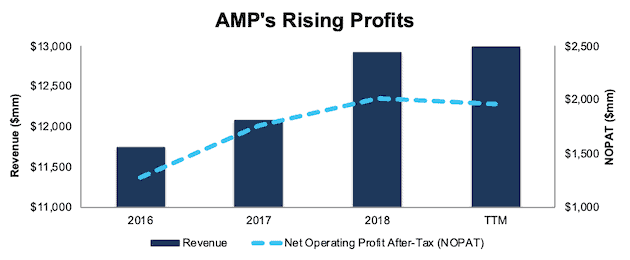
Sources: New Constructs, LLC and company filings
Steady Dividend Growth Supported by FCF
AMP has increased its annual dividend each of the past nine years. Its dividend has grown from $2.26/share in 2014 to $3.53/share in 2018, or 12% compounded annually. Its current quarterly dividend, $0.97/share, equates to $3.88/share annually. Most importantly, AMP easily generates the cash flow needed to continue paying and growing its dividend. Over the past five years, AMP has generated a cumulative $13.3 billion in FCF (60% of market cap) while paying $2.4 billion in dividends.
Companies with FCF well in excess of dividend payments provide higher quality dividend growth opportunities because we know the firm generates the cash to support a higher dividend. On the other hand, the dividend of a company where FCF falls short of the dividend payment over time cannot be trusted to grow or even maintain its dividend because of inadequate free cash flow.
Figure 2: Free Cash Flow (FCF) vs. Regular Dividend Payments
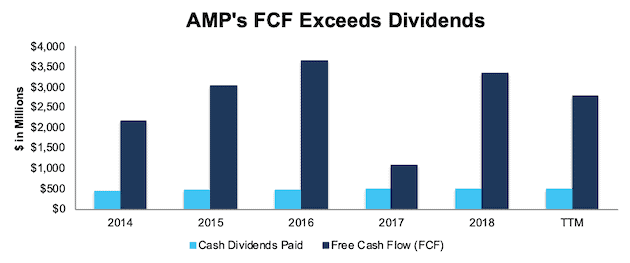
Sources: New Constructs, LLC and company filings
AMP is Undervalued
At its current price of $173/share, AMP has a price-to-economic book value (PEBV) ratio of 1.0. This ratio means the market expects AMP’s NOPAT to never grow from current levels. This expectation seems overly pessimistic for a firm that has grown NOPAT by 13% compounded annually since 2012 and 7% compounded annually since 2005.
If AMP can maintain TTM NOPAT margins (15%) and grow NOPAT by just 5% compounded annually for the next decade, the stock is worth $224/share today – a 29% upside. See the math behind this reverse DCF scenario. Add in AMP’s 2.2% dividend yield and history of dividend growth, and it’s clear why this stock is in January’s Dividend Growth Stocks Model Portfolio.
Critical Details Found in Financial Filings by Our Robo-Analyst Technology
As investors focus more on fundamental research, research automation technology is needed to analyze all the critical financial details in financial filings as shown in the Harvard Business School and MIT Sloan paper, "Core Earnings: New Data and Evidence”.
Below are specifics on the adjustments we make based on Robo-Analyst findings in Ameriprise Financial’s 2018 10-K:
Income Statement: we made $263 million of adjustments with a net effect of removing $85 million in non-operating income (< 1% of revenue). See all adjustments made to AMP’s income statement here.
Balance Sheet: we made $1.8 billion of adjustments to calculate invested capital with a net increase of $739 million. The most notable adjustment was $489 million (4% of reported net assets) related to deferred tax assets. See all adjustments to AMP’s balance sheet here.
Valuation: we made $1.7 billion of adjustments with a net effect of increasing shareholder value by $97 million. The most notable adjustment to shareholder value was $881 million in net assets from discontinued operations. This adjustment represents 4% of AMP’s market value. See all adjustments to AMP’s valuation here.
This article originally published on February 6, 2020.
Disclosure: David Trainer, Kyle Guske II, and Matt Shuler receive no compensation to write about any specific stock, style, or theme.
Follow us on Twitter, Facebook, LinkedIn, and StockTwits for real-time alerts on all our research.
[1] Harvard Business School features the powerful impact of our research automation technology in the case New Constructs: Disrupting Fundamental Analysis with Robo-Analysts.
[2] This paper compares our analytics on a mega cap company to Bloomberg and Capital IQ (SPGI) in a detailed appendix.