
Three new stocks make July’s Exec Comp Aligned with ROIC Model Portfolio, available to members as of July 15, 2020.
Recap from June’s Picks
Our Exec Comp Aligned with ROIC Model Portfolio (+0.3%) underperformed the S&P 500 (+0.6%) by 0.3% from June 16, 2020 through July 13, 2020. The best performing stock in the portfolio was up 10%. Overall, eight out of the 15 Exec Comp Aligned with ROIC Stocks outperformed the S&P from June 16, 2020 through July 13, 2020.
Only our research utilizes the superior data and earnings adjustments featured by the HBS & MIT Sloan paper,"Core Earnings: New Data and Evidence.” The success of this Model Portfolio highlights the value of our Robo-Analyst technology[1], which scales our forensic accounting expertise (featured in Barron’s) across thousands of stocks.
This Model Portfolio only includes stocks that earn an Attractive or Very Attractive rating and align executive compensation with improving ROIC. We think this combination provides a uniquely well-screened list of long ideas because return on invested capital (ROIC) is the primary driver of shareholder value creation.[2]
New Stock Feature for July: Gentex Corporation (GNTX: $26/share)
Gentex Corporation (GNTX) is the featured stock in July’s Exec Comp Aligned with ROIC Model Portfolio.
We made GNTX a Long Idea in December 2016 and reiterated it in April 2019. Since our most recent report, the stock has outperformed the S&P 500 (up 24% vs S&P up 13%) and remains undervalued.
Gentex has grown revenue by 13% compounded annually and after-tax profit (NOPAT) by 20% compounded annually over the past decade. Longer term, Gentex has grown NOPAT by 11% compounded annually over the past two decades. Gentex’s NOPAT margin increased from 12% in 2009 to 20% over the trailing-twelve-months (TTM), while its ROIC improved from 18% to 24% over the same time.
Figure 1: Revenue & NOPAT Since 2009
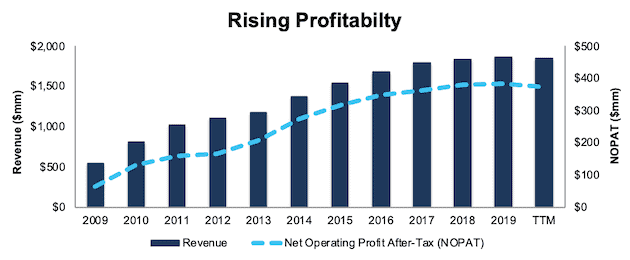
Sources: New Constructs, LLC and company filings
Compensation Plan Properly Incentivizes Executives
Gentex’s executive compensation plan aligns executives’ interests with shareholders’ interests by tying compensation to return on invested capital (ROIC). Apart from base salary and short-term incentives, Gentex executives receive long-term equity compensation in the form of restricted stock (RS) and performance based restricted share units (PSUs). PSU awards are tied to the achievement of three-year performance goals for EBITDA and ROIC.
While we would prefer an even greater tie to ROIC, Gentex’s focus on ROIC helps to ensure prudent stewardship of capital. Per Figure 2, Gentex has improved its ROIC from 21% in 2014 to 24% TTM.
Figure 2: Gentex Corporation’s ROIC Since 2014
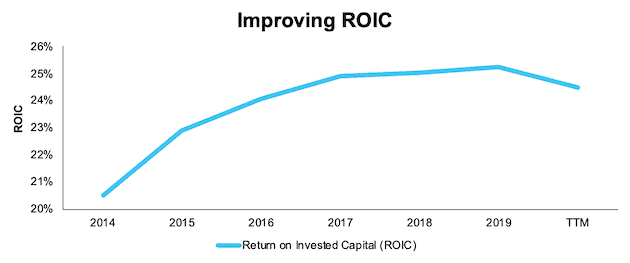
Sources: New Constructs, LLC and company filings
GNTX Is Undervalued
At its current price of $26/share, GNTX has a price-to-economic book value (PEBV) ratio of 0.9 This ratio means the market expects Gentex’s NOPAT to permanently decline by 10%. This expectation seems overly pessimistic for a firm that has grown NOPAT by 11% compounded annually over the past two decades.
Even if Gentex’s NOPAT margin falls to 19% (10-year average, compared to 20% TTM) and NOPAT grows by just 2% compounded annually for the next decade, the stock is worth $34/share today – a 31% upside. See the math behind this reverse DCF scenario.
Critical Details Found in Financial Filings by Our Robo-Analyst Technology
As investors focus more on fundamental research, research automation technology is needed to analyze all the critical financial details in financial filings as shown in the Harvard Business School and MIT Sloan paper, "Core Earnings: New Data and Evidence”.
Below are specifics on the adjustments we make based on Robo-Analyst findings in Gentex’s 2019 10-K:
Income Statement: we made $49 million of adjustments, with a net effect of removing $37 million in non-operating income (3% of revenue). You can see all the adjustments made to Gentex’s income statement here.
Balance Sheet: we made $634 million of adjustments to calculate invested capital with a net decrease of $476 million. One of the most notable adjustments was $68 million in asset write-downs. This adjustment represented 3% of reported net assets. You can see all the adjustments made to Gentex’s balance sheet here.
Valuation: we made $709 million of adjustments with a net effect of increasing shareholder value by $393 million. One of the largest adjustments to shareholder value was $551 million in excess cash. This adjustment represents 8% of Gentex’s market cap. See all adjustments to Gentex’s valuation here.
This article originally published on July 24, 2020.
Disclosure: David Trainer, Kyle Guske II, and Matt Shuler receive no compensation to write about any specific stock, style, or theme.
Follow us on Twitter, Facebook, LinkedIn, and StockTwits for real-time alerts on all our research.
[1] Harvard Business School features the powerful impact of our research automation technology in the case New Constructs: Disrupting Fundamental Analysis with Robo-Analysts.
[2] Compare our analytics on a mega cap company to Bloomberg and Capital IQ’s (SPGI) analytics in the detailed appendix of this paper.