This report highlights last month’s top performers and features a stock from the current portfolio. November’s Dividend Growth Stocks Model Portfolio was made available to members on November 29, 2017.
Recap from October’s Picks
Our Dividend Growth Stocks Model Portfolio underperformed the S&P 500 last month. The Model Portfolio rose 0.9% on a price return basis and 1.1% on a total return basis. The S&P 500 rose 1.8% on a price and total return basis. The portfolio’s best performing stock was Ross Stores (ROST), which was up 11%. Overall, 12 out of the 30 Dividend Growth Stocks outperformed the S&P last month, and 17 had positive returns.
The long-term success of our model portfolio strategies highlights the value of our Robo-Analyst technology, which scales our forensic accounting expertise (featured in Barron’s) across thousands of stocks[1].
The methodology for this model portfolio mimics an All-Cap Blend style with a focus on dividend growth. Selected stocks earn an Attractive or Very Attractive rating, generate positive free cash flow (FCF) and economic earnings, offer a current dividend yield >1%, and have a 5+ year track record of consecutive dividend growth. This model portfolio is designed for investors who are more focused on long-term capital appreciation than current income, but still appreciate the power of dividends, especially growing dividends.
Featured Stock from November: The TJX Companies (TJX: $75/share)
The TJX Companies (TJX), off-price apparel and furnishings retailer, is the featured stock from November’s Dividend Growth Stocks Model Portfolio.
Over the past decade, TJX’s revenue has grown by 7% compounded annually while after-tax profits (NOPAT) have grown by 11% compounded annually, per Figure 1. TJX’s NOPAT margin has improved from 5% in 2007 to 8% over the last twelve months. Long-term, TJX has grown NOPAT by 11% compounded annually since 1998.
Figure 1: TJX’s Revenue & NOPAT Growth Over Past Decade
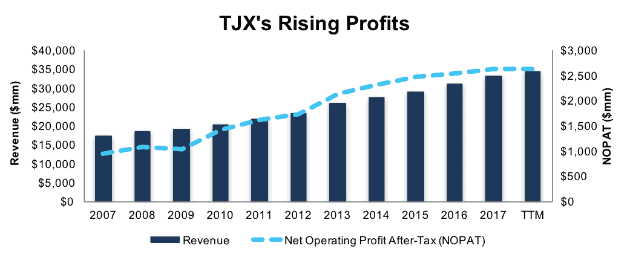
Sources: New Constructs, LLC and company filings
In addition to NOPAT growth, TJX’s return on invested capital (ROIC) has improved from 12% in 2007 to a top-quintile 17% TTM.
Steady Dividend Growth Supported by FCF
TJX has increased its regular dividend in each of the past 20 years. The current annualized dividend has grown from $0.46/share in 2013 to $1.20/share TTM, or 21% compounded annually. Growing FCF has fueled dividend growth in the past, and we expect the same for the future. From 2013-2017, TJX generated cumulative FCF of $8.7 billion (18% of market cap) and paid out cumulative dividends of $2.4 billion.
Companies with FCF well in excess of dividend payments provide higher quality dividend growth opportunities because we know the firm generates the cash to support the current dividend as well as a higher dividend. On the flip side, the dividend growth trajectory of a company where FCF falls short of the dividend payment over time cannot be trusted to grow or sustain its dividend because of inadequate free cash flow.
Figure 2: TJX’s Free Cash Flow (FCF) vs. Regular Dividend Payments
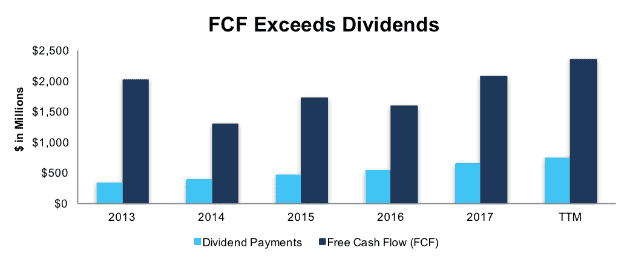
Sources: New Constructs, LLC and company filings
TJX Remains Undervalued
TJX is up only 2% year-to-date while the S&P is up 17%. The market’s aversion to all retail stocks has neglected even those firms with strong and improving fundamentals. At its current of $75/share, TJX has a price-to-economic book value (PEBV) ratio of 1.2. This ratio means the market expects TJX’s NOPAT to grow by no more than 20% over its remaining corporate life. This expectation seems overly pessimistic for a firm that has grown NOPAT by 11% compounded annually since 1998.
If TJX can maintain current NOPAT margins (8% TTM) and grow NOPAT by 8% compounded annually over the next decade, the stock is worth $123/share today – a 64% upside. Add in TJX’s 1.7% dividend yield and history of dividend growth, and it’s clear why this stock is in November’s Dividend Growth Stocks Model Portfolio.
Auditable Impact of Footnotes & Forensic Accounting Adjustments
Our Robo-Analyst technology enables us to perform forensic accounting with scale and provide the research needed to fulfill fiduciary duties. In order to derive the true recurring cash flows, an accurate invested capital, and a real shareholder value, we made the following adjustments to The TJX Companies’ 2017 10-K:
Income Statement: we made $837 million of adjustments with a net effect of removing $329 million in non-operating expense (1% of revenue). We removed $583 million related to non-operating expenses and $254 million related to non-operating income. See all adjustments made to TJX’s income statement here.
Balance Sheet: we made $10.3 billion of adjustments to calculate invested capital with a net increase of $5.7 billion. The most notable adjustment was $7 billion (87% of reported net assets) related to operating leases. See all adjustments to TJX’s balance sheet here.
Valuation: we made $11.4 billion of adjustments with a net effect of decreasing shareholder value by $9.1 billion. Apart from total debt, which includes the $7 billion in off-balance sheet operating leases noted above, the largest adjustment to shareholder value was $1.2 billion in excess cash. This cash adjustment represents 3% of TJX’s market value. Despite the decrease in shareholder value, TJX remains undervalued.
This article originally published on December 5, 2017.
Disclosure: David Trainer, Kyle Guske II, and Sam McBride receive no compensation to write about any specific stock, style, or theme.
Follow us on Twitter, Facebook, LinkedIn, and StockTwits for real-time alerts on all our research.
[1] Ernst & Young’s recent white paper “Getting ROIC Right” proves the superiority of our holdings research and analytics.