
Recap from September’s Picks
The best performing Most Attractive large cap stock gained 8% and the best performing small cap stock was up 20%. Overall, 12 out of the 40 Most Attractive stocks outperformed the S&P 500 in September, and 16 had positive returns.
Our Most Dangerous Stocks (-2.1%) outperformed the S&P 500 (-1.6%) as a short portfolio last month. The best performing large cap stock fell by 14% and the best performing small cap stock fell by 13%. Overall, 30 out of the 40 Most Dangerous stocks outperformed the S&P 500 as shorts in September.
The successes of these model portfolios highlight the value of our machine learning and AI Robo-Analyst technology[1], which helps clients fulfill the fiduciary duty of care and make smarter investments[2].
12 new stocks make our Most Attractive list this month and 10 new stocks fall onto the Most Dangerous list this month. October’s Most Attractive and Most Dangerous stocks were made available to members on October 3, 2018.
Our Most Attractive stocks have high and rising returns on invested capital (ROIC) and low price to economic book value ratios. Most Dangerous stocks have misleading earnings and long growth appreciation periods implied by their market valuations.
Most Attractive Stocks Feature for October: UBS Group (UBS: $15/share)
UBS Group (UBS), is the featured stock from October’s Most Attractive Stocks Model Portfolio. UBS was a featured Long Idea in November 2017 and remains Very Attractive.
In 2017, UBS grew revenue by 7% year-over-year while after-tax profit (NOPAT) grew 17% YoY to $6.1 billion. Over the trailing twelve-month period, NOPAT has grown to $6.4 billion, which is 28% greater than the prior TTM period. The company’s NOPAT margin has increased from 14.8% in 2016 to 15.7% TTM and its ROIC improved from 9% to 11% over the same time.
Figure 1: UBS’ Revenue & NOPAT Since 2016
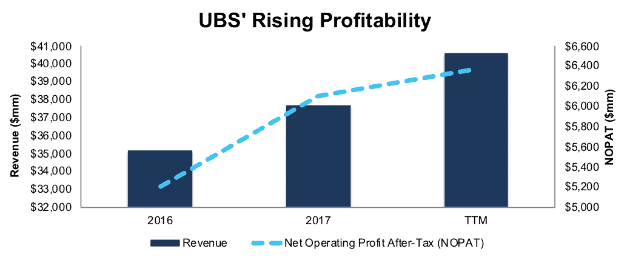
Sources: New Constructs, LLC and company filings
UBS Valuation Provides Significant Upside
At its current price of $15/share, UBS has a price-to-economic book value (PEBV) ratio of 0.7. This ratio means the market expects UBS’s NOPAT will permanently decline by 30%. This expectation seems pessimistic for a firm that is investing its business to succeed in the future of wealth management while earning significant profits.
If UBS can maintain TTM margins (16%) and grow NOPAT by just 5% compounded annually for the next decade, the stock is worth $28/share today – an 87% upside. See the math behind this dynamic DCF scenario.
Critical Details Found in Financial Filings by Our Robo-Analyst Technology
As investors focus more on fundamental research, research automation technology is needed to analyze all the critical financial details in financial filings. Below are specifics on the adjustments we make based on Robo-Analyst findings in UBS’ 2017 10-K:
Income Statement: we made $6.1 billion of adjustments, with a net effect of removing $5.0 billion in non-operating expense (13% of revenue). You can see all the adjustments made to UBS’ income statement here.
Balance Sheet: we made $23.4 billion of adjustments to calculate invested capital with a net decrease of $2.0 billion. One of the largest adjustments was $10.1 billion due to deferred tax assets. This adjustment represented 17% of reported net assets. You can see all the adjustments made to UBS’ balance sheet here.
Valuation: we made $4.7 billion of adjustments with a net effect of decreasing shareholder value by $4.7 billion. There were no adjustments that increased shareholder value. The largest adjustment to shareholder value was $3.7 billion in off-balance sheet operating leases. This adjustment represents 7% of UBS’ market cap.
Most Dangerous Stocks Feature: Advance Auto Parts (AAP: $166/share)
Advance Auto Parts (AAP), is the featured stock from October’s Most Dangerous Stocks Model Portfolio.
Since 2015, AAP’s revenue fell 2% compounded annually and its NOPAT fell 15% compounded annually, to $401 million in 2017. TTM NOPAT of $399 million is down 24% over the prior TTM period. Meanwhile, competitor, and previous Long Idea AutoZone (AZO), has grown revenue and NOPAT by 5% compounded annually since 2014. The company’s NOPAT margin fell from 7% in 2014 to 4% TTM while its ROIC fell from 10% to 6% over the same time.
Figure 2: AAP’s Declining NOPAT Since 2014
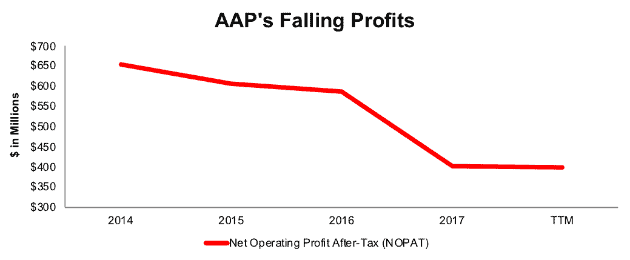
Sources: New Constructs, LLC and company filings
AAP Provides Poor Risk/Reward
Despite the deteriorating fundamentals, AAP is up 85% over the past year (S&P +13%) and 71% over the past five years (S&P +65%). The rising stock price leaves AAP with significant downside risk as the expectations baked into the stock price look overly optimistic.
To justify its current price, AAP must maintain current pre-tax margins (7%), benefit from lowered tax rates, and grow NOPAT by 10% compounded annually for the next 11 years. See the math behind this dynamic DCF scenario. This expectation seems lofty given that AAP’s NOPAT has fallen in recent years and grown only 3% compounded annually over the past decade.
Even if the company can maintain current pre-tax margins, benefit from lowered tax rates, and grow NOPAT by 6% compounded annually for the next decade, the stock is worth just $107/share today – a 36% downside. See the math behind this dynamic DCF scenario.
Critical Details Found in Financial Filings by Our Robo-Analyst Technology
As investors focus more on fundamental research, research automation technology is needed to analyze all the critical financial details in financial filings. Below are specifics on the adjustments we make based on Robo-Analyst findings in Advance Auto Parts’ 2017 10-K:
Income Statement: we made $602 million of adjustments, with a net effect of removing $74 million in non-operating income (1% of revenue). You can see all the adjustments made to AAP’s income statement here.
Balance Sheet: we made $2.8 billion of adjustments to calculate invested capital with a net increase of $2.2 billion. One of the largest adjustments was $2.4 billion due to off-balance sheet operating leases. This adjustment represented 48% of reported net assets. You can see all the adjustments made to AAP’s balance sheet here.
Valuation: we made $4.2 billion of adjustments with a net effect of decreasing shareholder value by $3.4 billion. Apart from $3.5 billion in total debt, which includes the operating leases noted above, the largest adjustment to shareholder value was $431 million in excess cash. This cash adjustment represents 4% of AAP’s market cap.
This article originally published on October 9, 2018.
Disclosure: David Trainer and Kyle Guske II receive no compensation to write about any specific stock, style, or theme.
Follow us on Twitter, Facebook, LinkedIn, and StockTwits for real-time alerts on all our research.
[1] Harvard Business School features the powerful impact of our research automation technology in the case New Constructs: Disrupting Fundamental Analysis with Robo-Analysts.
[2] Ernst & Young’s recent white paper “Getting ROIC Right” proves the superiority of our holdings research and analytics.
Click here to download a PDF of this report.
Photo Credit: herval (Flickr)