
We published an update on this Danger Zone pick on January 18, 2022. A copy of the associated Earnings Update report is here.
We put Peloton (PTON: $51/share) in the Danger Zone in September 2019 in anticipation of its IPO and reiterated our view in September 2020. Since then, the stock has outperformed as a short versus the S&P 500 by 93%. Indeed, the stock could be worth as little as $16/share, as consumers return to gyms, forgo pricy workout equipment, use cheaper alternatives, and lose interest in Peloton’s at-home offerings.
We leverage more reliable fundamental data, as proven in The Journal of Financial Economics[1] and shown to provide a new source of alpha, with qualitative research to pick this Danger Zone stock.
Peloton Still Has 69%+ Downside
- Peloton’s growth story is at risk as demand for its premium exercise equipment wanes. The firm’s shareholders own a serial cash burner with highly negative margins in an increasingly competitive market.
- Peloton is currently priced as if it will become more profitable than at any time in its history and will nearly double its market share in the coming years.
- If Peloton achieves modest margin improvement and maintains current market share, the stock is worth just $16/share today.
Figure 1: Danger Zone Performance: From September 2020 Danger Zone Through 11/19/21

Sources: New Constructs, LLC and company filings.
What’s Working for the Business
Peloton posted negative earnings in fiscal 1Q22 but was able to beat market expectations. Fiscal 1Q22 revenue grew 6% year-over-year (YoY) and revenue over the trailing-twelve months (TTM) is at record highs.
The number of subscribers to Peloton’s Connected Fitness Subscriptions continues to rise and is up from 1.3 million in fiscal 1Q21 to 2.5 million in fiscal 1Q22.
Management expects Connected Fitness Subscriptions to reach 2.8 million in fiscal 2Q22 and 3.4 million by the end of fiscal 2022.
What’s Not Working for the Business
Peloton’s YoY revenue comps were always going to be difficult given the unprecedented demand during the COVID-19 shutdowns. However, investment bank Jefferies notes that as economies have reopened interest in at-home exercise equipment fell to pandemic-era lows earlier this year. This change in consumer preference clearly weighed on Peloton’s fiscal 1Q22 results.
Below we highlight some of the key challenges that make it unlikely Peloton will achieve the expectations baked into its stock price.
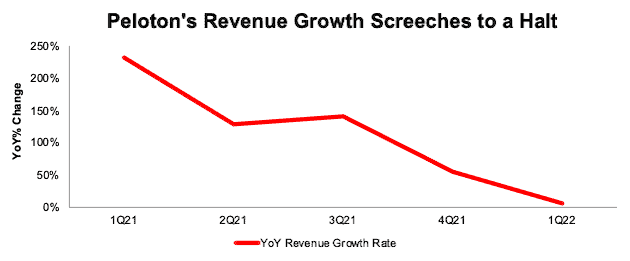
Revenue Growth Plummets. Since its IPO in September 2019, Peloton has been a “growth-story” stock with investors willing to ignore losses in return for rapid revenue growth. However, the growth story is coming to a halt as YoY revenue growth continues its multi-quarter slowdown. See Figure 2.
Despite cutting the price of its bike by $400 in August 2021, demand for Peloton’s equipment was especially weak in fiscal 1Q22. Revenue in its Connected Fitness segment (equipment, not subscriptions) fell 17% YoY and 24% quarter-over-quarter.
Management guided for fiscal 2Q22 revenue growth of just 8% YoY and full year revenue growth of just 14% YoY. Judging by the stock’s price movement post earnings, investors did not sign up for single-to-low double-digit growth rates.
Figure 2: Peloton’s Revenue Growth: Fiscal 1Q21 – Fiscal 1Q22
Sources: New Constructs, LLC and company filings.
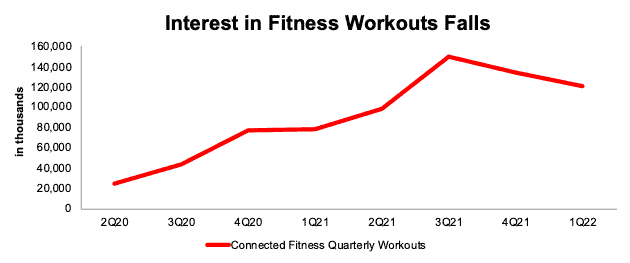
Interest in Workouts Falls, Too. Consumers using Peloton’s equipment and subscription workouts also fell in fiscal 1Q22, which continued a drop that began in the prior quarter. Per Figure 3, Connected Fitness Quarterly Workouts peaked at 149.5 million in fiscal 3Q21 (period ended March 2021) and fell to 120.5 million in fiscal 1Q22. The number of average monthly workouts per subscription fell to 17 in fiscal 1Q22, down from 20 in fiscal 4Q21 and 26 in fiscal 3Q21.
Figure 3: Peloton’s Quarterly Workouts: Fiscal 2Q20 – Fiscal 1Q22
Sources: New Constructs, LLC and company filings.
Slowdown in Growth Didn’t Result in Profits. Investors in a growth-story stock are more lenient when the top-line begins to slow if the company is reporting bottom-line improvements. Peloton is not.
Peloton’s total operating expenses, which include cost of sales, sales and marketing, general and administrative, and research and development have increased from 91% of revenue in fiscal 1Q21 to 145% of revenue in fiscal 1Q22.
Peloton’s net operating profit after-tax (NOPAT) margin peaked at 15% in fiscal 4Q20 and has fallen quarter-over-quarter in each quarter since. Peloton’s NOPAT margin fell to -31% in fiscal 1Q22 and -8% over the TTM period
Even on a non-GAAP basis, Peloton’s adjusted EBITDA margin, which removes real costs of doing business, fell to -29% in fiscal 1Q22, down from +16% in fiscal 1Q21.
Competition Is Plentiful. While Peloton garnered headlines for its trendy equipment and on-demand workout classes, many competitors have bolstered their own offerings or have entered the space. See our prior report for a detailed list of Peloton’s competitors and the crowded nature of the market.
More specifically, Apple (AAPL) has expanded its fitness subscription service, which already integrates with its existing suite of products. Amazon (AMZN) recently announced Halo Fitness, a service for home video workouts which integrates with Amazon’s Halo fitness trackers.
Tonal, which counts Amazon as an early investor, offers a wall-mounted strength training device, and Lululemon (LULU) offers the Mirror. Brands such as ProForm and NordicTrack have offered bikes, treadmills, and more for years and are ramping up their efforts in subscription workout class offerings. In response, Peloton announced its latest product, “Guide”, a camera that connects to a TV while tracking user movements to assist in strength training. Truist analyst Youssef Squali called the offering “underwhelming” compared to the competition.
Peloton’s struggles come as traditional gym competitors are seeing renewed demand. Planet Fitness’ (PLNT) calendar 3Q21 (same period as Peloton’s fiscal 1Q22) revenue grew 46% YoY, same store sales grew 7% YoY, and NOPAT margin was 22% in 3Q21, up from 14% in 3Q20.
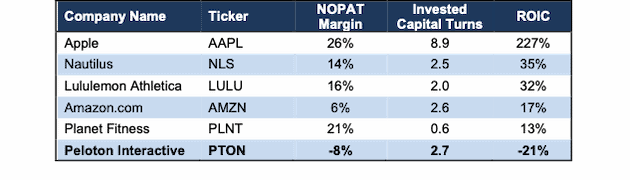
Competitors Are Much More Profitable. Of its publicly-traded peers, Peloton is the only one with negative NOPAT margins. The firm’s invested capital turns are higher than most of its competitors but are not enough to drive a positive return on invested capital (ROIC). With an ROIC of -21% over TTM, Peloton is also the only company in Figure 4 to generate a negative ROIC. See Figure 4.
Figure 4: Peloton’s Profitability vs. Competition: TTM
Sources: New Constructs, LLC and company filings.
This crowded competitive landscape undermines pricing power on equipment and subscription services. While Peloton may appeal to more affluent customers, there are many lower-priced options in the at-home equipment market that have broader market appeal. Additionally, many competing subscription services are priced below Peloton, which limits its attractiveness to new users. Lack of pricing power and differentiation present real problems in Peloton’s pursuit of achieving the revenue and profit growth expectations baked into its stock price.
Supply Chain Issues Could Further Dampen Margins
In its fiscal 1Q22 earnings call, Peloton management notes the entire company faces component shortages, elevated freight costs, and increased transportation costs. Specifically, in its commercial segment, management notes that “sourcing certain components parts is becoming materially more challenging” and that supply concerns mean the company has been unable to fulfill some of its commercial demand.
Going forward, ongoing supply chain issues could drive down Peloton’s already low profitability. Management stated in the fiscal 2Q21 earnings call the firm has a “significant amount of fixed costs associated with our supply chain” and that reduction in demand is creating margin compression.
Given the ongoing driver shortage, freight and transportation costs could remain elevated for some time, which means Peloton’s margins will suffer. Continued component shortages could also lead to unmet demand, and consumers looking elsewhere to available gym equipment.
However, the expectations baked into the stock price imply an immediate reversal to record high margins, as we’ll illustrate below.
Capital Raise Does Little to Fix Business
Peloton recently announced a public offering of ~24 million shares, which will result in net proceeds of ~$1 billion. The company intends to use the proceeds for general corporate purposes. When looking at Peloton’s expenses and cash burn, this equity raise was necessary to remain a going concern.
As of fiscal 1Q22, Peloton had $924 million in cash and equivalents on its balance sheet. This cash could only sustain its fiscal 1Q22 cash burn of -$908 million for one more quarter. Over the TTM, Peloton burned through -$2.4 billion in free cash flow, a rate that could only be sustained for under five months using existing cash.
Even with the addition of $1 billion in cash from the equity sale, Peloton can only sustain its fiscal 1Q22 cash burn rate for another two quarters without raising additional capital.
Peloton Is Priced to Quadruple Sales Despite Weakening Demand
At $51/share, Peloton is currently priced as if it will become more profitable than any time in its history and nearly double its market share over the next seven years.
Specifically, to justify its current price of $51/share, Peloton must:
- improve its NOPAT margin to 5% (3x Peloton’s best-ever margin, compared to -8% TTM), and
- grow revenue at a 21% CAGR through fiscal 2028 (nearly 3x projected home gym equipment industry growth over the next seven years).
In this scenario, Peloton would generate $15.2 billion in revenue in fiscal 2028, which is nearly 4x its TTM revenue and 8x its pre-pandemic fiscal 2020 revenue. At $15.2 billion, Peloton’s revenue would imply a 22% share of its total addressable market (TAM) in calendar 2027, which we consider the combined online/virtual fitness and at-home fitness equipment markets. For reference, Peloton’s share of its TAM in calendar 2020 was just 12%. Of competitors with publicly available sales data, iFit Health, owner of NordicTrack and ProForm, Beachbody (BODY), and Nautilus held, respectively, 9%, 6%, and 4% of the TAM in 2020.
We think it’s overly optimistic to assume Peloton will double its market share given the current competitive landscape while also achieving margins 3x higher than the company has ever achieved. Recent price cuts to its products indicate high prices are unsustainable and could pressure margins even more in the coming years. In a more realistic scenario, detailed below, the stock has large downside risk.
PTON Has 47%+ Downside if Consensus Is Right: Even if we assume Peloton’s
- NOPAT margin improves to 4.2% (more than 2x its best-ever margin and equal to Nautilus’ 10-year average NOPAT margin prior to COVID-19) and
- revenue grows at consensus rates in fiscal 2022, 2023, and 2024 and
- revenue grows 14% a year in fiscal 2025-2028 (nearly 2x home gym equipment industry CAGR through calendar 2027, and equal to guidance for fiscal 2022 growth), then
the stock is worth $27/share today – a 47% downside to the current price. This scenario still implies Peloton’s revenue grows to $12 billion in fiscal 2028, a 17% share of its total addressable market.
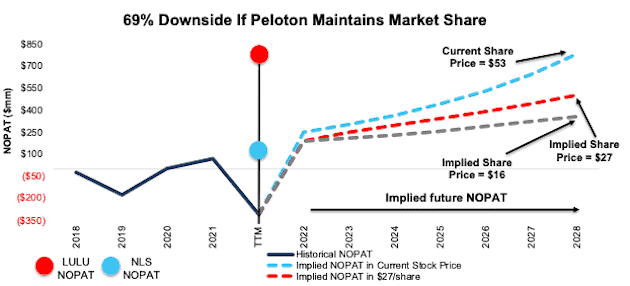
PTON Has 69% Downside if It Maintains Current Market Share: If we assume Peloton’s
- NOPAT margin improves to 4.2% and
- revenue grows 11% compounded annually through fiscal 2028, then
the stock is worth just $16/share today – a 69% downside to the current price. In this scenario, Peloton would generate $8.5 billion in revenue in fiscal 2028, which would equal 12% of its projected TAM, equal to its share of the TAM in calendar 2020.
If Peloton fails to achieve the revenue growth or margin improvement we assume for this scenario, the downside risk in the stock would be even higher.
Figure 5 compares Peloton’s historical NOPAT to the NOPAT implied by each of the above DCF scenarios.
Figure 5: Peloton’s Historical vs. Implied NOPAT
Sources: New Constructs, LLC and company filings.
Dates represent Peloton’s fiscal year, which runs through June of each year
The above scenarios assume Peloton’s change in invested capital equals 10% of revenue in each year of our DCF model. For reference, Peloton’s annual change in invested capital averaged 24% of revenue from fiscal 2019 to fiscal 2021, and equaled 52% of revenue over the TTM.
Each scenario above also accounts for the share offering and subsequent cash received. We conservatively treat this cash as excess cash on the balance sheet to create best-case scenarios. However, should Peloton’s cash burn continue at current rates, the company will likely need this capital much sooner, and the downside risk in the stock is even higher.
Check out this week’s Danger Zone interview with Chuck Jaffe of Money Life.
This article originally published on November 22, 2021.
Disclosure: David Trainer, Kyle Guske II, and Matt Shuler receive no compensation to write about any specific stock, sector, style, or theme.
Follow us on Twitter, Facebook, LinkedIn, and StockTwits for real-time alerts on all our research.
[1] Our research utilizes our Core Earnings, a more reliable measure of profits, proven by professors at Harvard Business School & MIT Sloan and featured in The Journal of Financial Economics.