
We published an update on PTON on February 9, 2022. A copy of the associated update report is here.
Our Focus List Stocks: Short Model Portfolio outperformed the S&P 500 as a short portfolio by 36% in 2021 with 29 out of our 31 picks outperforming the index. This is the first of three reports reviewing the biggest winners from this Model Portfolio last year and their potential returns for this year. We reviewed our worst performers from 2021 here.
Peloton (PTON: $37/share) outperformed as a short in 2021 and we remain bearish on the stock. We also feature two other Focus List: Short stocks that outperformed in 2021, Beyond Meat (BYND) here and Koss Corp (KOSS) here.
Focus List Stocks: Short Outperformed in 2021
The Focus List Stocks: Short Model Portfolio contains the best of our Danger Zone picks and leverages superior fundamental data, as proven in The Journal of Financial Economics[1], which provides a new source of alpha. This Model Portfolio is available in real-time to Pro and higher members, or you can purchase the current version of the Model Portfolio here.
The Focus List Stocks: Short Model Portfolio fell, on average, -16% in 2021 compared to an average return of 20% for the S&P 500, per Figure 1[2].
Figure 1: Focus List Stocks: Short Model Portfolio Performance from Period Ending 4Q20 to 4Q21
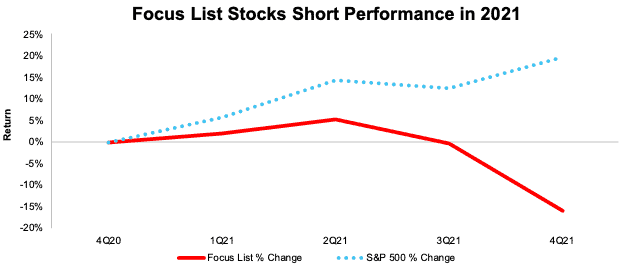
Sources: New Constructs, LLC
Because our Focus List Stocks: Short Model Portfolio represents the best of the best picks, not all Danger Zone picks we publish make the Model Portfolio. We published 46 Danger Zone Reports in 2021 but added just 11 of those picks to the Focus List Stocks: Short Model Portfolio during the year. Currently, the Focus List Stocks: Short Model Portfolio holds 28 stocks.
Figure 2 shows a more detailed breakdown of the Model Portfolio’s performance, which encompasses all the stocks that were in the Model Portfolio at any time in 2021.
Figure 2: Performance of Stocks in the Focus List Stocks: Short Model Portfolio in 2021
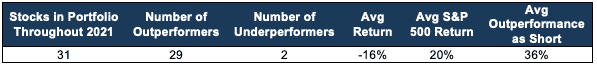
Sources: New Constructs, LLC
Performance includes the performance of stocks currently in the Focus List Stocks: Short Model Portfolio, as well as those removed during the year, which is why the number of stocks in Figure 2 (31) is higher than the number of stocks currently in the Model Portfolio (28).
Winner: Focus List Stocks: Short: Peloton (PTON): Down 76% vs. S&P 500 Up 27% in 2021
We originally added Peloton to our Focus List Stocks: Short Model Portfolio in October 2020, and it outperformed as a short by 103% in 2021. Even after falling 76% in 2021, Peloton’s valuation remains disconnected from the reality of the firm’s fundamentals and could fall much further. See our most recent report on Peloton here.
Main Reason for Short Outperformance: COVID Bump Wasn’t Sustainable: After COVID-19-induced lockdowns drove consumers to in-home workout equipment,Peloton’s year-over-year (YoY) revenue comps were always going to be difficult to top. As expected, as economies reopened, interest in at-home exercise equipment fell, and Peloton’s “growth story” unraveled in 2021 as YoY revenue growth continues a multi-quarter slowdown.
At the end of last year, many analysts issued concerning (for bulls) notes about Pelton’s future results. Guggenheim and Raymond James both noted that subscriptions are likely to be lower than expected due to weakening demand. JMP Securities highlighted website visits and page views declined YoY in December.
Why We Remain Bearish on Peloton: Competitive Market Means Shares Still Hold 63% Downside: We outline the numerous headwinds Peloton faces in our report here. The biggest challenge to any Peloton bull case is the rising competition from incumbents and startups across the home exercise equipment industry, along with Peloton’s continued lack of profitability.
For instance, Apple (AAPL) has expanded its fitness subscription service, which already integrates with its existing suite of products. Amazon (AMZN) recently announced Halo Fitness, a service for home video workouts which integrates with Amazon’s Halo fitness trackers.
Tonal, which counts Amazon as an early investor, offers a wall-mounted strength training device, and Lululemon (LULU) offers the Mirror. Brands such as ProForm and NordicTrack have offered bikes, treadmills, and more for years and are ramping up their efforts in subscription workout class offerings. In response, Peloton announced its latest product, “Guide”, a camera that connects to a TV while tracking user movements to assist in strength training. Truist analyst Youssef Squali called the offering “underwhelming” compared to the competition.
Peloton’s struggles also come as traditional gym competitors are seeing renewed demand.
Furthermore, of its publicly-traded peers, which include Apple, Nautilus (NLS), Lululemon, Amazon, and Planet Fitness (PLNT), Peloton is the only one with negative net operating profit after-tax (NOPAT) margins. The firm’s invested capital turns are higher than most of its competitors but are not enough to drive a positive return on invested capital (ROIC). With an ROIC of -21% over TTM, Peloton is also the only company listed above to generate a negative ROIC. See Figure 3.
Figure 3: Peloton’s Profitability vs. Competition: TTM
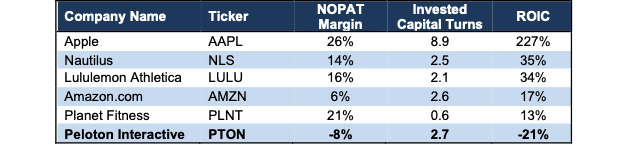
Sources: New Constructs, LLC and company filings.
Peloton Is Priced to Triple Sales Despite Weakening Demand
We use our reverse discounted cash flow (DCF) model to quantify the expectations for future profit growth baked into the current stock price. Despite a massive declines to $37/share, Peloton is currently priced as if it will become more profitable than any time in its history. We see no reason to expect an improvement in profitability and view the expectations implied by Peloton’s current valuation as still unrealistically optimistic about the company’s future prospects.
Specifically, to justify its current price of $37/share, Peloton must:
- improve its NOPAT margin to 5% (3x Peloton’s best-ever margin, compared to -8% TTM), and
- grow revenue at a 17% CAGR through fiscal 2028 (more than 2x projected home gym equipment industry growth over the next seven years).
In this scenario, Peloton would generate $12.4 billion in revenue in fiscal 2028, which is over 3x its TTM revenue and 7x its pre-pandemic fiscal 2020 revenue. At $12.4 billion, Peloton’s revenue would imply an 18% share of its total addressable market (TAM) in calendar 2027, which we consider the combined online/virtual fitness and at-home fitness equipment markets. For reference, Peloton’s share of its TAM in calendar 2020 was just 12%. Of competitors with publicly available sales data, iFit Health, owner of NordicTrack and ProForm, Beachbody (BODY), and Nautilus held, respectively, 9%, 6%, and 4% of the TAM in 2020.
We think it is overly optimistic to assume Peloton will vastly increase its market share given the current competitive landscape while also achieving margins three times higher than the company’s highest ever margin. Recent price cuts to its products indicate high prices are unsustainable and could pressure margins even more in the coming years. In a more realistic scenario, detailed below, the stock has large downside risk.
PTON Has 42%+ Downside if Consensus Is Right: Even if we assume Peloton’s
- NOPAT margin improves to 4.2% (more than 2x its best-ever margin and equal to Nautilus’ 10-year average NOPAT margin prior to COVID-19),
- revenue grows at consensus rates in fiscal 2022, 2023, and 2024, and
- revenue grows 14% a year in fiscal 2025-2028 (nearly 2x home gym equipment industry CAGR through calendar 2027, and equal to guidance for fiscal 2022 growth), then
the stock is worth $22/share today – a 42% downside to the current price. This scenario still implies Peloton’s revenue grows to $11.1 billion in fiscal 2028, a 16% share of its total addressable market.
PTON Has 63% Downside if Market Share Does Not Grow: If we assume Peloton’s
- NOPAT margin improves to 4.2% and
- revenue grows 11% compounded annually through fiscal 2028, then
the stock is worth just $14/share today – a 63% downside to the current price. In this scenario, Peloton would generate $8.5 billion in revenue in fiscal 2028, which would equal 12% of its projected TAM, equal to its share of the TAM in calendar 2020.
If Peloton fails to achieve the revenue growth or margin improvement we assume for this scenario, the downside risk in the stock would be even higher.
Figure 4 compares Peloton’s historical NOPAT to the NOPAT implied by each of the above DCF scenarios.
Figure 4: Peloton’s Historical vs. Implied NOPAT
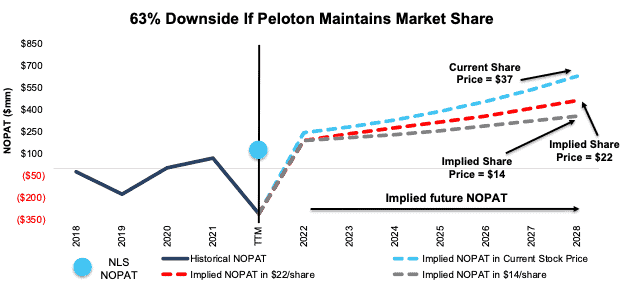
Sources: New Constructs, LLC and company filings.
Dates represent Peloton’s fiscal year, which runs through June of each year
The above scenarios assume Peloton’s change in invested capital equals 10% of revenue in each year of our DCF model. For reference, Peloton’s annual change in invested capital averaged 24% of revenue from fiscal 2019 to fiscal 2021, and equaled 52% of revenue over the TTM.
Each scenario above also accounts for the recent share offering and subsequent cash received. We conservatively treat this cash as excess cash on the balance sheet to create best-case scenarios. However, should Peloton’s cash burn continue at current rates, the company will likely need this capital much sooner, and the downside risk in the stock is even higher.
This article originally published on January 18, 2022.
Disclosure: David Trainer, Kyle Guske II, and Matt Shuler receive no compensation to write about any specific stock, sector, style, or theme.
Follow us on Twitter, Facebook, LinkedIn, and StockTwits for real-time alerts on all our research.
[1] Our research utilizes our Core Earnings, a more reliable measure of profits, as proven in Core Earnings: New Data & Evidence, written by professors at Harvard Business School (HBS) & MIT Sloan and published in The Journal of Financial Economics.
[2] Performance represents the price performance of each stock during the time in which it was on the Focus List Stocks: Short Model Portfolio in 2021. For stocks removed from the Focus List in 2021, performance is measured from the beginning of 2021 through the date the ticker was removed from the Focus List. For stocks added to the Focus List in 2021, performance is measured from the date the ticker was added to the Focus List through December 31, 2021.