In our market outlook, we showed the market as a whole is more expensive than it’s been at any point since before the ’08 recession. We may not be in tech bubble territory yet, but there are many “micro-bubbles” throughout the market where individual security valuations have become disconnected from cash flows.
However, the existence of micro-bubbles doesn’t mean that every part of the market is overvalued. In fact, there are also micro-bubble winners or pockets of securities that are undervalued based on overblown fears of disruption. At times, entire industries, not just one or two stocks, can look like a micro-bubble winner.
The market underestimates the barriers to entry in this industry, and as a result, valuations for many of the companies imply profits will permanently decline. The Banking Services Industry is this week’s Long Idea.
Superior Rating Distribution
The Financials sector currently ranks as the top-rated sector according to our Sector Ratings methodology, and Banking Services is our top-rated industry within the Financials sector. Both the Banking Services industry and the Financials sector as a whole earn our Very Attractive rating.
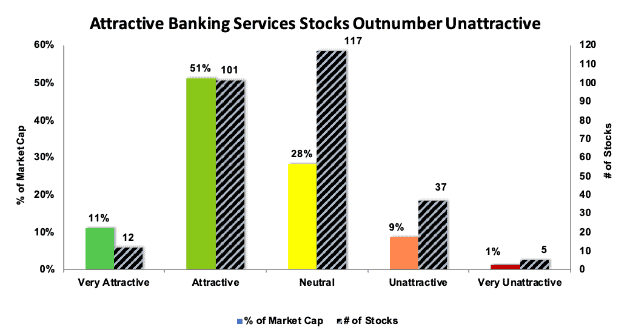
Figure 1 shows the distribution of our ratings for stocks in the Banking Services industry. More than twice as many stocks earn an Attractive-or-better rating (113) than earn an Unattractive-or-worse rating (42). When we weight by market cap, 62% of the industry earns an Attractive-or-better rating.
Figure 1: Rating Distribution for the Banking Services Industry
Sources: New Constructs, LLC and company filings
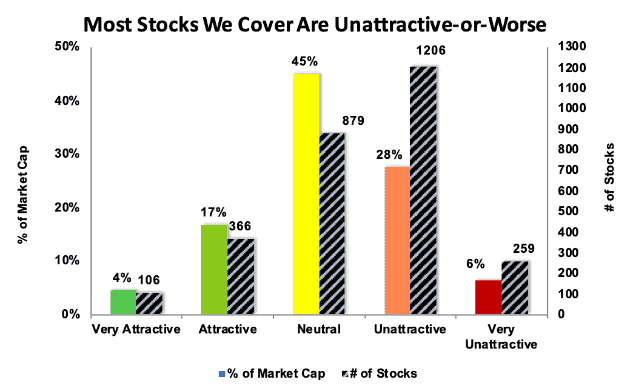
By comparison, Figure 2 shows the rating distribution of our entire coverage universe, which encompasses over 2,800 U.S. and international stocks. 1,465 of the stocks we cover (52% of our coverage universe) earn an Unattractive-or-worse rating.
Figure 2: Rating Distribution for Our Entire Coverage Universe
Sources: New Constructs, LLC and company filings
In a market where most stocks look risky, the Banking Services industry offers an unusually high concentration of high-quality stocks.
Cheap Valuation Across the Industry
The Banking Services industry earns our Very Attractive rating primarily due to its cheap valuation. The SPDR KBW Bank ETF (KBE) has significantly underperformed the S&P 500 over the past five years (up 43% vs. S&P up 57%) and ten years (up 124% vs. S&P up 205%). As a result of this long-term underperformance, bank stocks are now significantly cheaper than the market as a whole, both by traditional valuation metrics and more advanced measures of market expectations.
On a price to earnings (P/E) basis, the industry has a P/E of 11 compared to a P/E of 22 for the S&P 500. The Banking Services industry’s P/E is even below the Financials sector as a whole, which has a P/E of 13.
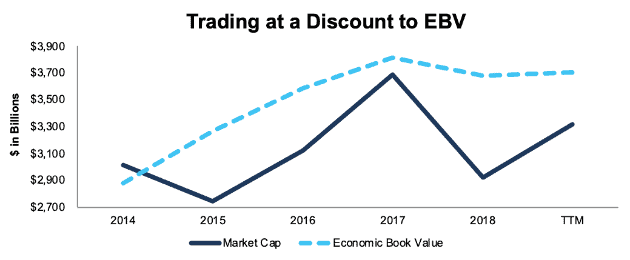
When we compare the aggregate market cap of the stocks in the industry to their economic book value (EBV) – i.e. their zero-growth value – we find a similar story. The industry was valued at a slight premium to EBV in 2014, but after its relative underperformance over the past five years, it is now valued at a 10% discount. See Figure 3.
Figure 3: Banking Services Industry Market Cap vs. EBV: 2014-Current
Sources: New Constructs, LLC and company filings
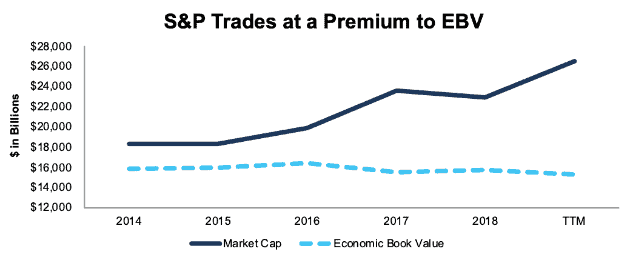
By comparison, the S&P 500 on aggregate is valued at a 70% premium to its EBV. See Figure 4.
Figure 4: S&P 500 Market Cap vs. EBV: 2014-Current
Sources: New Constructs, LLC and company filings
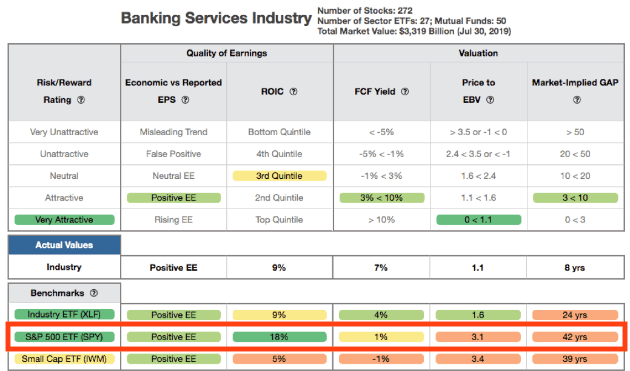
The divergence becomes even more stark when we look at the industry on a cap-weighted average basis. Figure 5 shows that the Banking Services industry has a weighted average PEBV of just 1.1. The benchmarks section at the bottom of Figure 5 shows the S&P 500 (SPY) has a PEBV of 3.1.
Figure 5: Banking Services Industry Rating Table
Sources: New Constructs, LLC and company filings
Stocks in the industry also offer an average free cash flow yield of 7% compared to just 1% for the S&P, and they have a market implied growth appreciation period (GAP) of just 8 years compared to 42 years for the S&P.
Some of this disconnect can be explained by the industry’s lower return on invested capital (ROIC). However, Banking Services stocks are still significantly cheaper than other sectors with significantly lower ROIC’s. The Household Goods industry, for example, has a PEBV of 2.8 despite earning a weighted average ROIC of just 7%.
The cheap valuation for bank stocks can’t be explained by their cash flows alone. Below, we examine two bearish angles on the industry, and why they don’t hold up to further scrutiny.
Bear Case: Tech Companies Will Disrupt Banking
The first bear case revolves around the idea that tech companies will disrupt the banking industry. Whether it’s giants like Facebook (FB) and Apple (AAPL), smaller companies such as Square (SQ), or the more recent hype around cryptocurrency, investors have long viewed banks as susceptible to disruption.
However, we’ve yet to see real signs of any disruption materialize. Tech companies have made some inroads in payments with products like Apple Pay, but they haven’t taken over the actual functions of banking in any real capacity. At best, companies like Square have inserted themselves into the consumer-facing side of the lending process while traditional banks still handle the actual functions of holding deposits, underwriting loans, and managing regulatory compliance.
What tech companies have repeatedly discovered is that the barriers to entry in the banking industry are not limited to technology or capital. Banks have a great deal of specialized expertise in developing financial products, handling the back-end work of managing money, and maintaining a complex network of relationships with consumers, corporations, regulators, and other financial entities. All this expertise is extremely difficult for tech companies to copy.
In addition, the tech world no longer has the positive public image that it enjoyed just a few years ago, due in large part to repeated privacy scandals and concerns that tech companies are already too big. Consumers and regulators aren’t likely to take a positive view of tech companies getting into the financial world. One only has to look at the negative response to Facebook’s “Libra” cryptocurrency to see how difficult it will be for big tech to be allowed to take over banking.
In the end, we see technological innovation as a bullish factor for the banking sector. As we wrote in “Big Banks Will Win the Fintech Revolution”, we expect to see technology companies ultimately partnering with or being acquired by banks in a way that will make the industry more efficient and profitable overall.
Bear Case: Falling Interest Rates Spell Doom for Banks
The other concern for the Banking Services industry is that falling interest rates will lead to a decline in profitability in the near-term. This concern is especially relevant after the Fed’s recent announcement of a 25 basis point rate cut.
However, Fed chair Jerome Powell also indicated that this rate cut is not necessarily the start of a longer cycle of declining rates. Interest rates are already fairly low, so investors shouldn’t necessarily expect significant cuts to rates in the near future.
In addition, falling interest rates have not always led to poor performance for bank stocks. As analyst Mike Mayo recently noted, bank stocks outperformed in 1995 when the Fed cut rates. Lower rates help strengthen credit and minimize defaults, and these factors offset some of the negative impact of lower net interest margins.
Finally, the market has expected this rate cut for quite some time and it appears already priced in to the industry. The fact that banks have underperformed over the past five years – a period where rates have mostly been rising – indicates that interest rates alone don’t determine the valuation for the Banking Services industry.
Investors Should Do Their Own Diligence
While our metrics are bullish on the Banking Services industry overall, investors should use our ratings as a starting point for their own diligence when analyzing companies in this sector. In particular, our ratings tend not to capture issues not disclosed in 10-Ks and 10-Qs, such as credit quality issues hidden in VIEs and leadership turnover, that play a big role in determining stock performance for banking stocks.
Wells Fargo (WFC) is a good example of a stock where our ratings may not tell the entire story. Our system recently upgraded WFC to Very Attractive based on its high free cash flow and cheap valuation. However, Viola Risk Advisors recently noted that the bank’s credit risk, along with its continued regulatory risk and lack of stable leadership, present significant red flags that offset the cheap valuation.
On the other hand, Viola is much more bullish on JP Morgan (JPM), a stock that we have an Attractive rating on. They see lower credit risk for JPM and less risk from falling rates due to its high interest credit card portfolio.
We believe our ratings are a good starting point for finding value in the Banking Services industry, but investors should also dig into these factors before making investment decisions.
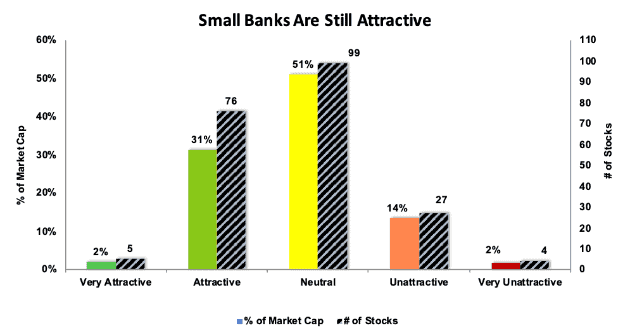
While our ratings (or any one rating for that matter) can’t tell the whole story of any individual company in the industry, we still believe they accurately represent the value in the industry as a whole and are not just the result of big banks like WFC skewing the metrics. As Figure 6 shows, even if we restrict our analysis to banks with a market cap below $5 billion, there are still many more Attractive-or-better rated stocks in the industry than there are Unattractive-or-worse rated stocks.
Figure 6: Rating Distribution for Banking Services Stocks Below $5 Billion Market Cap
Sources: New Constructs, LLC and company filings
A Very Attractive Banking Services Stock: Bank of Hawaii (BOH)
Bank of Hawaii (BOH: $86/share) is one of our favorite stocks in the Banking Services industry and earns our Very Attractive rating. BOH stands out for its consistent profitability, even during the 2008/2009 recession. The company has earned an ROIC above 10% in every year going back to 2003, and it currently earns a 13% ROIC.
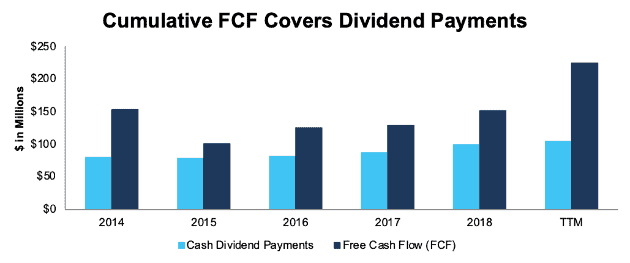
In addition, BOH generates steady free cash flow that allows the company to support a high and growing dividend. Over the past four years, BOH has increased its quarterly dividend from $0.45/share in 2015 to $0.65/ share currently, or 10% compounded annually. The current dividend offers an annualized yield of 3.1%, well above the S&P 500 at 1.9%. BOH’s free cash flow consistently exceeds its dividend payments, as shown in Figure 7.
Figure 7: Bank of Hawaii: Free Cash Flow vs. Cash Dividend Payments: 2014-TTM
Sources: New Constructs, LLC and company filings
In addition, BOH is less exposed to changes in interest rates than many other banks due to the relatively high percentage of its loan portfolio allocated to fixed rate mortgages. The company projects that a gradual 100 basis point decline in interest rates would only lead to a 1.2% decline in net interest income.
BOH’s track record of maintaining a high ROIC in low and declining interest rate environments should also give investors confidence that the bank can continue to thrive even if rates fall.
At its current stock price of $86/share, BOH has a PEBV of just 1.0. This ratio implies that the market expects zero growth for the company into perpetuity. This expectation seems overly pessimistic for a company that has grown after-tax operating profit (NOPAT) by 3% compounded annually over the past 20 years.
If BOH can continue to grow NOPAT by 3% compounded annually for the next 15 years, the stock is worth $102/share today – a 19% upside to the current stock price. See the math behind this dynamic DCF scenario.
BOH is a good example of the kind of value we see in the Banking Services industry. It has a strong track record of growth and profitability, relatively low risk, and trades at a significant discount to the market.
This article originally published on July 31, 2019.
Disclosure: David Trainer, Kyle Guske II, and Sam McBride receive no compensation to write about any specific stock, style, or theme.
Follow us on Twitter, Facebook, LinkedIn, and StockTwits for real-time alerts on all our research.
