We published an update on ORCL on June 29, 2022. A copy of the associated Earnings Update report is here.
We published an update on DIS and WMT on May 19, 2021. A copy of the associated Earnings Update report is here.
Most are familiar with the phrase “a rising tide lifts all boats.” In the current market, the “rising tide” is actually just a few large and highly profitable companies that account for almost all of the economic earnings growth in the market. Meanwhile, many flashy, yet low-quality companies, see their valuations reach unrealistic levels, while the steady, more consistent firms get overlooked.
In August 2018, we grouped many of these low quality companies into Micro-Bubbles, or groups of stocks with extraordinary risk within an overall market that is not nearly as overvalued. We deemed these stocks as overvalued because their valuations assumed they would take significant market share away from the highly profitable incumbents in their industries. As a result, these incumbents are undervalued by the market despite their large and growing cash flows. When the micro-bubbles burst, these incumbents stand to benefit.
These “Micro-Bubble winners” remain undervalued even though many of them have outperformed their Micro-Bubble counterparts and the overall market while the valuations of the micro-bubble stocks remain stretched. Going forward, we expect these micro-bubble winners to continue to outperform. General Motors (GM: $40/share), The Walt Disney Company (DIS: $141/share), Oracle Corporation (ORCL: $58/share), and Walmart Inc. (WMT: $113/share) are this week’s Long Ideas.
Automotive Expertise Remains an Unrivalled Competitive Advantage: General Motors (GM)
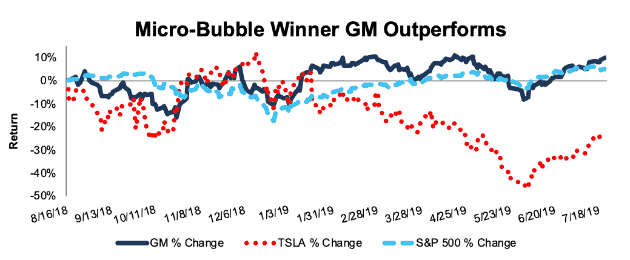
We first picked General Motors (GM) as a stock that would benefit from the bursting of Tesla’s (TSLA) micro-bubble on August 16, 2018. Since we published our report, GM has outperformed and is up 10%, while the S&P 500 is up 5% and TSLA is down 24%, per Figure 1.
Figure 1: GM Outperforms TSLA and the S&P 500 Since August 2018
Sources: New Constructs, LLC and company filings
The issues at Tesla are well-documented and include “production hell”, “delivery logistics hell”, shortcuts in manufacturing, executive departures en masse, and more. Most importantly, the company has yet to prove it can generate a lasting profit. In 2018, Tesla’s economic earnings stood at -$1.6 billion, and, over the trailing twelve months, remain at -$1.6 billion. The company’s free cash flow is -$815 million TTM, and it currently earns a 0% return on invested capital (ROIC).
Meanwhile, General Motors’ economic earnings have been positive each of the past nine years and TTM period. It generated nearly $21 billion (37% of market cap) in free cash flow over the past five years, and it earns an 8% ROIC, which is greater than Fiat Chrysler (FCAU), Nissan Motor Co. (NSANY), and Ford Motor Company (F).
What’s more, GM has strong future growth opportunities in EV’s and self-driving. The Chevy Bolt remains one of the best-selling EV models, and the company recently announced plans for all-electric Cadillac models. Meanwhile, GM’s Cruise unit remains a recognized leader in the self-driving space and has a standalone valuation of $19 billion (33% of GM’s market cap).
The Numbers Behind the Valuation Disconnect
Our dynamic DCF model demonstrates the extent to which Tesla is overvalued and General Motors is undervalued by quantifying the cash flow expectations baked into their valuations.
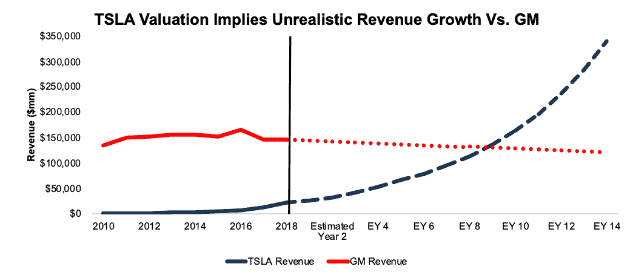
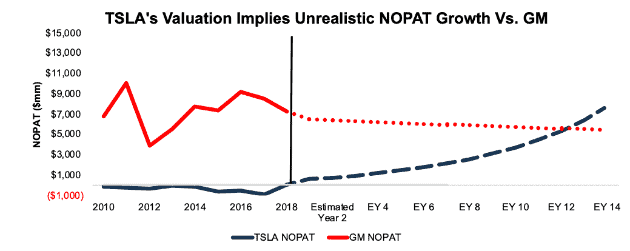
Tesla’s current valuation of $256/share implies the firm will achieve an after-tax operating profit (NOPAT) margin of 2% (equal to Ford) and grow revenue by 22% a year for 14 years. In this scenario, TSLA earns $340 billion in revenue in year 14, which is 25% greater than Toyota Motor Corp’s (TM) 2018 revenue. See the math behind this dynamic DCF scenario.
Meanwhile, General Motors’ current valuation of $40/share implies the firm’s NOPAT margin will fall to 4% (from 5% in 2018) and revenue will decline by 1% compounded annually for 14 years. See the math behind this dynamic DCF scenario.
Figure 2 compares the revenue implied by these scenarios to the historical results of these companies dating back to 2010.
Figure 2: Tesla Vs. General Motors: Historical and Implied Revenue
Sources: New Constructs, LLC and company filings
Figure 3 compares the NOPAT implied by these scenarios to the historical results of these companies dating back to 2010.
Figure 3: Tesla Vs. General Motors: Historical and Implied NOPAT
Sources: New Constructs, LLC and company filings
The Potential Upside for General Motors
GM’s economic book value (EBV)– or zero-growth value – is $82 billion, but its market cap is ~$57 billion (just 70% of EBV), so the market is projecting a permanent 30% cash flow decline for the company’s future.
If General Motors can simply maintain TTM margins (5%) and grow NOPAT by just 2% compounded annually for the next decade, the stock is worth $62/share today – a 55% upside. See the math behind this dynamic DCF scenario.
As TSLA’s valuation continues its fall back to reality, GM shares should benefit as investors realize that it’s not about to lose as much market share and cash flow as implied by its current valuation.
Bet on the Best Content Creator: Disney (DIS)
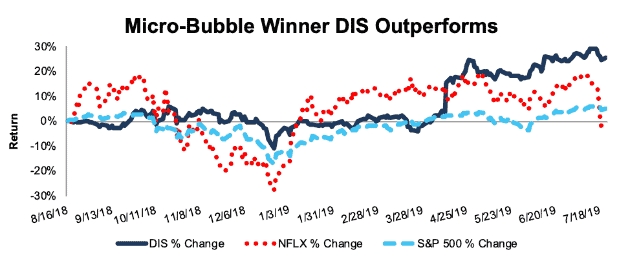
Our thoughts on Disney are summed up perfectly in our recent article “Disney’s Avengers Spells Endgame for Netflix.” The market seems to agree with us too. Since we named Disney a micro-bubble winner on August 16, 2018, it is up 25%, while the S&P 500 is up 5% and Netflix (NFLX), the original micro-bubble stock, is down 4%, per Figure 4.
Figure 4: DIS Outperforms NFLX and the S&P 500 Since August 2018
Sources: New Constructs, LLC and company filings
As Disney+ prepares to take on Netflix, the two companies exist at opposite ends of the spectrum in terms of their approach to content development. Netflix takes a “hands-off” approach that greenlights a ton of projects (~700 shows and movies in 2018) and gives a great deal of leeway to the creators. As a result, Netflix creates a large number of niche shows that appeal to limited audiences.
Meanwhile, Disney leans on a small number of recognizable franchises that appeal to wide audiences. The company’s approach can be summed up by CEO Bob Iger, speaking at the MoffettNathanson Media & Communications Summit earlier this year:
“When we build things based on IP that's already popular, you tend to get higher returns on those investments.”
Iger was referring to the company’s parks strategy with that answer, but it applies to their content spending as well. Disney consistently builds its content strategy around existing IP, including acquiring recognizable IP such as Pixar, Marvel, Lucasfilm, and now Fox.
At the same time, Netflix’s results are showing signs of weakness, especially after the company recently reported its lowest quarterly subscriber growth numbers in three years, and its first domestic subscriber loss since 2011. See our report “Netflix’s Original Content Strategy is Failing” for more details.
The Numbers Behind the Valuation Disconnect
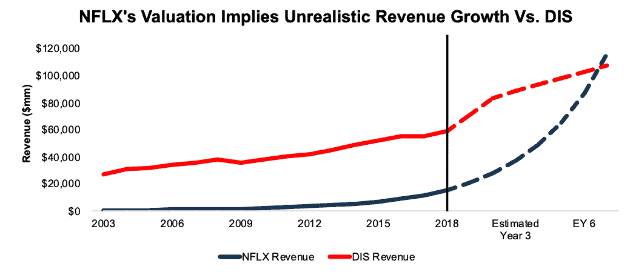
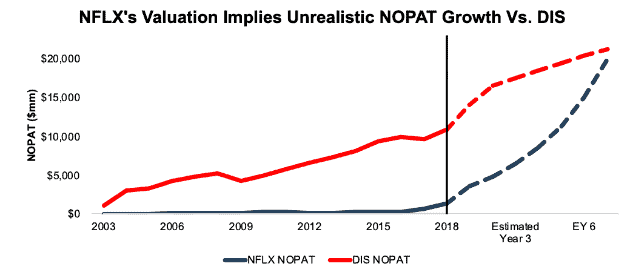
Netflix’s current valuation of $311/share implies the firm will achieve a NOPAT margin of 17% (equal to Disney) and grow revenue by 33% a year for seven years. In this scenario, NFLX earns $116 billion in revenue in year 7, which equates to over 645 million subscribers paying $15/month. See the math behind this dynamic DCF scenario.
Disney’s current valuation of $140/share implies the firm will maintain 2018 margins and grow revenue by 19% compounded annually for two years (driven by the Fox acquisition) and then 5% compounded annually in years 3-7. See the math behind this dynamic DCF scenario.
Figures 5 and 6 compare the revenue and NOPAT implied by these scenarios to the historical results of these companies dating back to 2003.
Figure 5: Netflix Vs. Disney: Historical and Implied Revenue
Sources: New Constructs, LLC and company filings
The market’s expectations imply that Netflix, which has grown revenue by 31% compounded annually since 2003, will accelerate that revenue growth to 33% annually over the next seven years. Meanwhile, the market expects Disney’s long-term growth rate to remain unchanged at 5%.
Figure 6: Netflix Vs. Disney: Historical and Implied NOPAT
Sources: New Constructs, LLC and company filings
Netflix has grown NOPAT by 45% compounded annually since 2003, but its valuation implies it will grow NOPAT by 48% compounded annually over the next seven years. Meanwhile, Disney has grown NOPAT by 17% compounded annually since 2003, but even with the boost from the Fox acquisition the market only expects 10% annual NOPAT growth over the next seven years.
The Potential Upside for Disney
We believe DIS will continue to outperform, and due to its cheap valuation, we see significant potential upside for Disney.
If Disney can earn the same ROIC from the Fox acquisition as it has for the rest of its business (12%) and grow organic revenue by 6% compounded annually over the next decade, the stock is worth $189/share today, a 34% upside to the current stock price. See the math behind this dynamic DCF scenario.
Even this scenario might prove too pessimistic. After all, it only implies a 12% compounded annual NOPAT growth rate, which is below the company’s historical average.
If Disney can grow NOPAT by 17% compounded annually over the next decade, equal to its historical growth rate, the stock has a fair value of $330/share today, a 135% upside to the current stock price. See the math behind this dynamic DCF scenario.
Follow the Cash to a Cloud Leader: Oracle (ORCL)
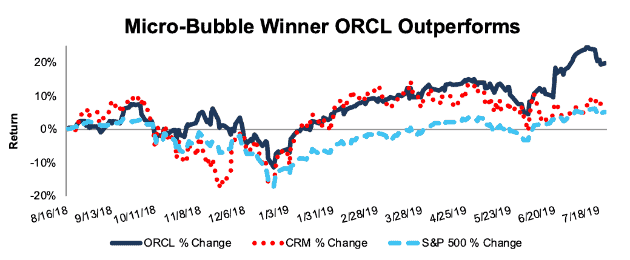
We picked Oracle (ORCL) as a stock that would benefit from the bursting of salesforce.com’s (CRM) micro-bubble. Since we published our report on August 16, 2018, ORCL has outperformed and is up 20%, while CRM is up 8% and the S&P 500 is up 5%, per Figure 7.
Figure 7: ORCL Outperforms CRM and the S&P 500 Since August 2018
Sources: New Constructs, LLC and company filings
Salesforce dominates headlines with its rapid revenue growth and overpriced acquisitions, such as the recently announced $15.7 billion deal to acquire Tableau (DATA). Despite the headlines, CRM has failed to generate positive economic earnings in any year since 2011, and it has burned through $11.4 billion (9% of market cap) in FCF over the past five years.
Meanwhile, Oracle continues to prove naysayers wrong, and management is not going to allow the “legacy” provider to be surpassed in the cloud opportunity. In fact, Oracle CEO Mark Hurd noted in the most recent conference call that “Oracle gained the most market share globally out of all enterprise applications SaaS vendors three years running—in calendar year ‘16, ‘17 and ‘18.”[1]
Furthermore, the company generates significant free cash flow, to the tune of $35.5 billion (18% of market cap) over the past five years and currently earns a top-quintile ROIC of 20%. As the market sours on CRM’s lofty revenue growth and little profit growth, we expect ORCL to continue to benefit.
The Numbers Behind the Valuation Disconnect
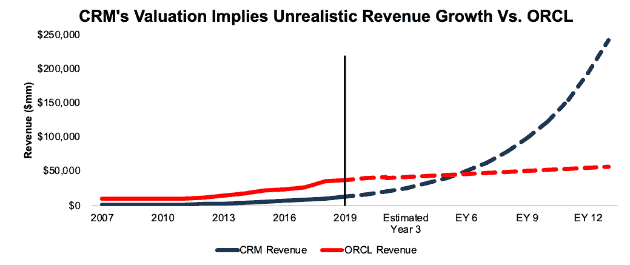
CRM’s current valuation of $158/share implies the firm will achieve a NOPAT margin of 8% (double its current margin) and grow revenue by 25% a year for 13 years. In this scenario, CRM would generate $242 billion in revenue in year 13, which is over six times Oracle’s fiscal 2019 revenue. See the math behind this dynamic DCF scenario.
Meanwhile, Oracle’s current valuation of $58/share implies the firm’s NOPAT margin will fall to 29% (from 30% in 2018) and revenue and NOPAT will grow by just 3% compounded annually for the next 13 years. See the math behind this dynamic DCF scenario.
Figure 8 compares the revenue and NOPAT implied by these scenarios to the historical results of these companies since 2007.
Figure 8: Salesforce Vs. Oracle: Historical and Implied Revenue
Sources: New Constructs, LLC and company filings
The market’s expectations imply that salesforce, which has grown revenue by 29% compounded annually over the past decade, will maintain that revenue growth, at 25%, while doubling margins over the next 13 years. Meanwhile, the market expects Oracle’s long-term growth rate to fall from 5% compounded annually since 2009 to 3% compounded annually over the next 13 years.
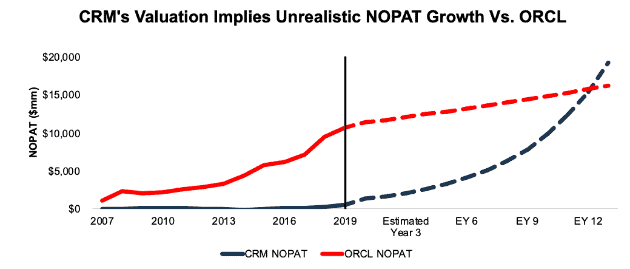
Figure 9 compares the NOPAT implied by these scenarios to the historical results of these companies since 2007.
Figure 9: Salesforce vs. Oracle: Historical and Implied NOPAT
Sources: New Constructs, LLC and company filings
Salesforce has grown NOPAT by 29% compounded annually since 2009, but its valuation implies it will grow NOPAT by 32% compounded annually over the next 13 years. Meanwhile, Oracle has grown NOPAT by 7% compounded annually since 2009, but the market only expects 3% compounded annual NOPAT growth over the next 13 years.
The Potential Upside for Oracle
We believe ORCL’s vast resources and growing customer base will allow it to continue to take market share. In doing so, the market will be forced to recognize its position as a leader in the cloud space, and allocate capital accordingly.
If Oracle can simply maintain fiscal 2019 margins (30%) and grow NOPAT by just 4% compounded annually for the next decade, the stock is worth $68/share today – a 17% upside. See the math behind this dynamic DCF scenario. With continued success in its cloud business, this scenario could prove conservative.
This Retail Giant Isn’t Going Anywhere: Walmart (WMT)
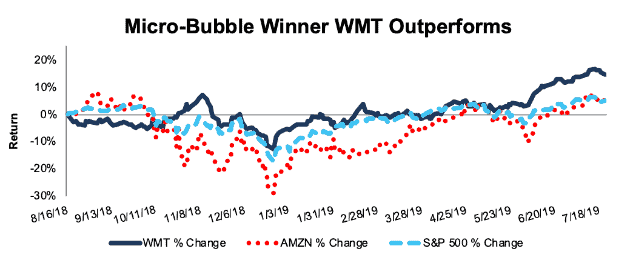
We picked Walmart (WMT) as a stock that would benefit from the bursting of Amazon’s (AMZN) micro-bubble. Since we published our report on August 16, 2018, WMT is up 14%, while AMZN and the S&P are up 5%, per Figure 10.
Figure 10: WMT Outperforms AMZN and the S&P 500 Since August 2018
Sources: New Constructs, LLC and company filings
Talking heads love to speculate on which industry Amazon will “dominate” next and often cite the “Amazon Threat” as a bearish indicator for stocks in any number of industries. However, this e-commerce giant is not as mighty as the headlines would have you believe. While its e-commerce market share is estimated at ~38%, its overall share of U.S. retails sales is “in the low single digits” according to CEO Jeff Bezos and less than 5% according to industry research provider eMarketer.
Amazon’s $233 billion in revenue in 2018 is just over half of Walmart’s $514 billion. Walmart’s existing store footprint and geographical reach allows it to invest heavily in e-commerce, while Amazon must overpay for physical retail locations in an effort to reach consumers where they’re most likely to shop. The difference in business models explains why Walmart has generated positive free cash flow of $72 billion (22% of market cap) over the past five years while Amazon has negative free cash flow of $63 billion (6% of market cap) over the same time.
Walmart is also building out an impressive eCommerce business, despite the headlines of impending doom. E-commerce sales grew 40% year-over-year in 2018 and another 37% YoY in fiscal 1Q20. Overall comparable sales grew 3.6% in 2018 and 3.4% in fiscal 1Q20, which represents the highest Q1 comp in nine years.
Furthermore, Walmart’s grocery pickup was noted as a key contributor to its e-commerce growth in fiscal 1Q20, and its success highlights the flaw in Amazon’s retail business – the lack of physical stores. Amazon has integrated Prime and Whole Foods to offer grocery pickup and delivery, but its scale is dwarfed by Walmart. By the end of the year, Walmart plans to expand same-day grocery delivery and grocery pickup to 50% and 80% of the U.S. population respectively. Omnichannel market intelligence provider Numerator estimates that 65% of Walmart’s online grocery customers are also Prime members. In other words, Amazon’s own members, which have access to online grocery ordering as a Prime member, are choosing to use Walmart when ordering groceries online.
The Numbers Behind the Valuation Disconnect
Despite Walmart’s clear success in e-commerce, as well as the continued growth of its brick-and-mortar operations, investors continue to buy into the “death of retail” narrative. Even after WMT’s recent outperformance, it remains significantly undervalued, and AMZN remains significantly overvalued.
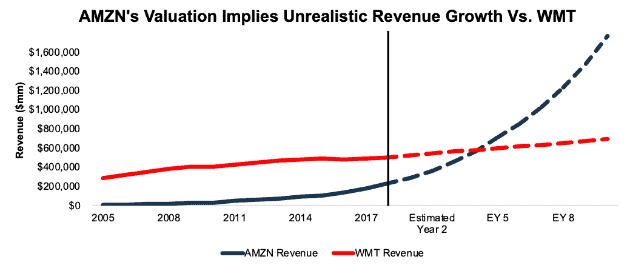
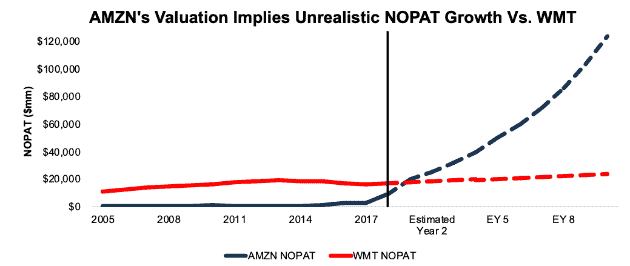
Amazon’s current valuation of $1,994/share implies the firm will improve its NOPAT margin to 7% (vs. 5% TTM, which was highest in company history) and grow revenue by 23% a year for 10 years. This margin improvement and revenue growth would result in NOPAT growth of 29% compounded annually. In this scenario, AMZN earns over $1.8 trillion in revenue in year 10, which is over three times Walmart’s 2018 revenue. See the math behind this dynamic DCF scenario.
Meanwhile, Walmart’s current valuation of $112/share implies the firm will maintain its fiscal 2019 NOPAT margin (3%) and revenue and NOPAT will grow by just 3% compounded annually for 10 years. See the math behind this dynamic DCF scenario.
Figure 11 compares the revenue implied by these scenarios to the historical results of these companies dating back to 2005.
Figure 11: Amazon vs. Walmart: Historical and Implied Revenue
Sources: New Constructs, LLC and company filings
Figure 12 compares the NOPAT implied by these scenarios to the historical results of these companies dating back to 2005.
Figure 12: Amazon vs. Walmart: Historical and Implied NOPAT
Sources: New Constructs, LLC and company filings
The Potential Upside for Walmart
We believe WMT’s geographical footprint, distribution network, and cash resources available to invest in new/improved retail operations will allow it to continue growing profits.
If WMT can improve margins by just 30 basis points (3.6% from 3.3%) and grow NOPAT by 4% compounded annually for the next 15 years, the stock is worth $144/share today – a 29% upside. See the math behind this dynamic DCF scenario. For reference, WMT has grown NOPAT by 4% compounded annually over the past 15 years.
Identifying Micro-Bubbles Can Prove Beneficial
When we analyzed earnings across the entire market last year, we found that tax cuts accounted for all the economic earnings growth, and, when removed, economic earnings actually declined 2% YoY. More recently, only a few firms are generating any positive economic earnings at all, and their success is overshadowing the poor results of lower-quality companies. As a group, the S&P 500 companies earned a cumulative $344 billion in economic earnings in 2018. The top 10 earners accounted for 48% of aggregate economic earnings and the top 25 accounted for 75%. In total, 165 companies in the S&P 500 generated negative economic earnings in 2018.
However, the markets rise as “earnings growth” appears to remain intact. In reality, just a few highly successful firms are making real money while accounting loopholes mask the true cash flows of the majority of businesses. This disconnect between economic earnings and valuation cannot last forever. Avoiding those stocks with valuations that imply unrealistic revenue and profit growth and buying their undervalued counterparts can provide, not only a level of safety, but also outperformance in an increasingly risky market.
This article originally published on July 24, 2019.
Disclosure: David Trainer, Kyle Guske II, and Sam McBride receive no compensation to write about any specific stock, style, or theme.
Follow us on Twitter, Facebook, LinkedIn, and StockTwits for real-time alerts on all our research.
[1] According to International Data Corporation (IDC), a provider of industry insights and research.
