We published an update on this Long Idea on February 28, 2024. A copy of the associated report is here.
After a record 2020, this company is still firing on all cylinders in 2021. Strong earnings, coupled with improving fundamentals, macro tailwinds, and an undervalued stock price mean NVR Inc. (NVR: $5,200/share) remains a Long Idea.
We leverage more reliable fundamental data, as proven in The Journal of Financial Economics[1] and shown to provide a new source of alpha, with qualitative research to pick this Long Idea.
NVR Inc. Has Very Attractive Risk/Reward
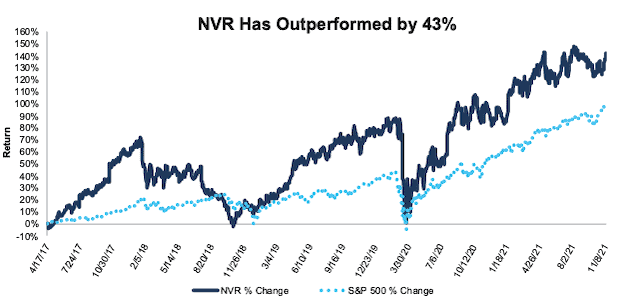
We made NVR Inc. a Long Idea in April 2017 and reiterated our opinion on the stock in November 2017, February 2019 and March 2020. Since our original report, the stock has outperformed the S&P 500 by 43%. Despite strong outperformance, NVR remains undervalued and holds 56%+ upside.
Figure 1: Long Idea Performance: From Date of Publication Through 11/9/21
Sources: New Constructs, LLC and company filings
NVR reported earnings on October 21, 2021, but didn’t file its 3Q21 10-Q with the SEC until November 2, 2021. With the 10-Q in hand, we can analyze the firm’s updated financials and quantify the expectations for future profit growth (or lack thereof) in its current stock price.
What’s Working for the Company
2020 was NVR’s most profitable year since 1998, as record demand for single family homes drove revenue and profits. That success has continued through to 2021 with net operating profit after-tax (NOPAT) over the trailing twelve months (TTM) rising to 37% above 2020 levels.
Homebuilding revenues were up 22% year-over-year (YoY) in 3Q21 and closed loans were up 17% YoY in the quarter as well. Overall revenue was up 20% YoY in 3Q21 and 29% YoY through the nine months ended September 30, 2021.
NVR’s record sales have coincided with improved profits. NVR’s NOPAT margin of 14.4% in 3Q21 is up from 13.6% in 3Q20 and 12.4% in 3Q19. NVR’s 14.2% NOPAT margin over the TTM is its highest since at least 1998. NVR’s invested capital turns, a measure of balance sheet efficiency, improved from 2.7 in 2015 to 3.3 over the TTM.
Rising operational and balance sheet efficiency drive NVR’s return on invested capital (ROIC) from 21% in 2015 to 35% in 2020 and 47% over the TTM. Per Figure 2, NVR’s ROIC is the best among the five largest homebuilders (by total closings), which include D.R. Horton (DHI), PulteGroup (PHM), Lennar Corporation (LEN), and Taylor Morrison Home (TMHC).
The balance sheet efficiency and high ROIC are also a testament to NVR’s asset-light business model, which focuses on lot purchase agreements rather than buying, owning, and developing its own land.
Figure 2: NVR Profitability vs. Next Four Largest U.S. Homebuilders: TTM
Sources: New Constructs, LLC and company filings
While NVR is a smaller builder relative to the “big three” of D.R. Horton (which we also like), Lennar Corporation, and PulteGroup, it has consistently grown its share of the homebuilding market. In 2007, prior to the housing/economic crash, NVR was the ninth largest U.S. homebuilder with just 3% market share based on total home closings. In 2021, NVR is the fourth largest U.S. homebuilder with 5% market share.
Going forward, NVR’s backlog of homes sold but not closed as of September 30, 2021 period remains strong. The number of units in the backlog remained flat YoY, but the dollar value of those units rose from $4.7 billion at the end of 3Q20 to $5.4 billion at the end of 3Q21, as the average sales price of a new NVR home rose 15% over the same time.
The industry’s robust growth in recent years is expected to continue for at least a few more years. The Mortgage Bankers Association estimates single-family housings starts to be 1.13 million in 2021, grow to 1.16 million in 2022 and hit 1.21 million in 2023. JPMorgan estimates single-family housing starts will grow 7% in 2021 and 2022 due to “favorable demand drivers and some still-tight supply.”
What’s Not Working for the Firm
While NVR’s sales are up YoY, the growth is due to higher home prices, not more homes sold. New orders fell 22% YoY in 3Q21 and 3% YoY through the first nine months of 2021. While NVR and other homebuilders have been able to push increased costs (due to supply chain disruptions – see below) onto consumers, a continued rise in house prices could push prospective buyers out of the market and weaken demand.
Increased construction activity and the impacts of COVID-19 on the global transportation of goods have resulted in supply chain disruptions across the industry. In addition, like many other industries, home construction is also facing labor constraints. NVR expects these issues to continue over the next several quarters, specifically as suppliers ”continue to work through the disruptions to meet the increased demand.”
The risk of rising rates looms large over buyers’ ability to purchase new homes. While average 30-year mortgage rates remain historically low, they rose to 2.98% for the week ending November 10, 2021, up from a low of 2.65% in January 2021. The National Association of Realtors expects rates to reach 3.5% by mid-2022, which would be the highest since early 2020 and could be a headwind for new home purchases.
The risk of higher rates reducing demand is lessened by the fact that the United States as a whole doesn’t have enough homes. Realtor.com estimates the U.S. is short 5.2 million homes, an increase of 1.4 million from the shortage in 2019. Homebuilders would have to double their new home production pace to close the gap in five to six years. Such a large need for new homes gives homebuilders ample runway for future growth.
NVR Is Priced for Permanent Profit Decline
At its current price, NVR has a price-to-economic book value (PEBV) ratio of 0.8. This ratio means the market expects NVR’s profits to permanently decline 20%. This expectation seems rather pessimistic for a company that has grown NOPAT by 13% compounded annually since 1998. Furthermore, consensus estimates expect NVR’s EPS to grow 43% YoY in 2021 and another 21% YoY in 2022, a clear disconnect from the expectations baked into the stock price.
Below, we use our reverse DCF model to analyze the expectations for future growth in cash flows baked into a couple of stock price scenarios for NVR Inc.
In the first scenario, we assume NVR’s:
- NOPAT margin falls to 7% (lowest level since 2014, compared to 14% TTM and an 11% 5-year average) from 2021 through 2030 and
- revenue grows by 8% compounded annually from 2021 to 2030 (vs. consensus estimates of 24% in 2021 and 10% in 2022), then
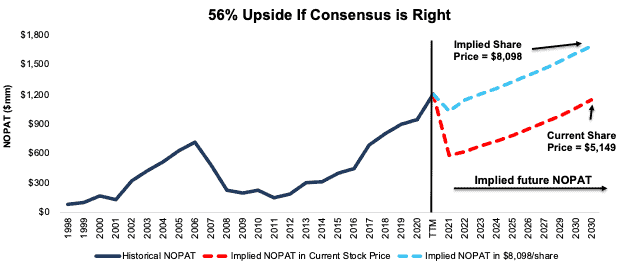
the stock is worth $5,149/share today – nearly equal to the current stock price. In this scenario, NVR’s NOPAT in 2030 is still below the company’s TTM NOPAT.
Shares Could Reach $8,098 or Higher: If we assume NVR’s:
- NOPAT margin falls to 11% (5-year average) from 2021 through 2030 and
- revenue grows by consensus rates in 2021 and 2022, and
- grows revenue by 5% a year from 2023 – 2030, then
the stock is worth $8,098/share today – 56% above the current price. See the math behind this reverse DCF scenario. For reference, NVR has grown revenue by 8% compounded annually since 1998 and 9% compounded annually over the past five years. Additionally, this scenario assumes NVR grows NOPAT by 6% compounded annually through 2030, which would be less than half its NOPAT CAGR since 1998.
Should NVR maintain current margins or grow revenue and profits even faster than assumed above, the stock has even more upside.
Figure 3: NVR’s Historical and Implied NOPAT: DCF Valuation Scenarios
Sources: New Constructs, LLC and company filings
This article originally published on November 10, 2021
Disclosure: David Trainer, Kyle Guske II, and Matt Shuler receive no compensation to write about any specific stock, sector, style, or theme.
Follow us on Twitter, Facebook, LinkedIn, and StockTwits for real-time alerts on all our research.
[1] Our research utilizes our Core Earnings, a more reliable measure of profits, as proven in Core Earnings: New Data & Evidence, written by professors at Harvard Business School (HBS) & MIT Sloan and published in The Journal of Financial Economics.


