We published an update on DHI on February 16, 2022. A copy of the associated Earnings Update report is here.
The Archegos margin call serves as another reminder that investors should include reliable fundamental research in their decision-making process. Doing so points us to D.R. Horton (DHI: $89/share), which has the largest share of the U.S. homebuilding market and superior profitability to peers and is this week’s Long Idea.
We made D.R. Horton a Long Idea in April 2020 based on its long history of profit growth and industry leading profitability. Since then, the stock is up 112% vs. 38% for the S&P 500. The run-up in the stock since our report may have some investors wondering if it’s time to take the gains and invest elsewhere. Our answer is no: this stock still offers quality risk/reward given D.R. Horton’s:
- position to benefit from very low home inventory levels
- capturing market share in the middle-priced segment of the housing market
- long-term tailwinds from rising work from home trends
- superior profitability to peers
- valuation implies an impending housing crisis that will be worse than 2008
Lower Inventory Levels Means Housing Demand Is Strong
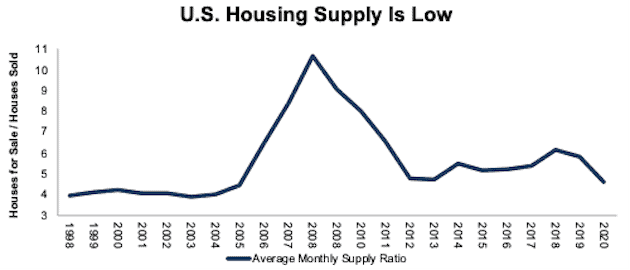
Inventory levels in the U.S. housing market have significantly declined since 2018, in large part to due rising demand. The monthly supply of houses is a ratio of houses for sale to houses sold. In 2020, the average monthly supply ratio was 4.6 months of supply. For comparison, the average monthly supply ratio since 1963 is 6.0, and the monthly supply ratio in February 2021 is 4.8.
Figure 1: U.S. Average Monthly Supply Ratio Since 1998
Sources: New Constructs, LLC and FRED.
And Drivers of Demand Should Persist
The cause for the rise in demand during the pandemic is primarily twofold:
- historically low interest rates
- the pandemic served as a catalyst for millennials to buy homes
Many buyers have flooded the market to take advantage of all-time low rates. While interest rates may fluctuate over the short term, rates over the long term are likely to be lower for longer. We have long argued that the 200-year trend of falling interest rates is likely to persist as free markets now influence interest rates more than the Federal Reserve. Additionally, the surge in global governments’ debt levels means governments are among the greatest beneficiaries of low interest rates and are likely to stay out of the way of naturally falling rates.
Millennials own homes at a much lower rate than the baby boomer generation at the same age even though the rate of ownership among millennials rose from 43% in 2019 to 48% in 2020. As the largest generation, increases in home ownership among millennials will drive demand for housing well after the pandemic. In its 1Q21 earnings call, D.R. Horton noted that the surge of millennial buying in fiscal 2020 as 42% of its sales were to buyers aged 34 and below. That same group accounted for just 35% of the firm’s sales in fiscal 2019.
D.R. Horton Is Positioned to Take Market Share
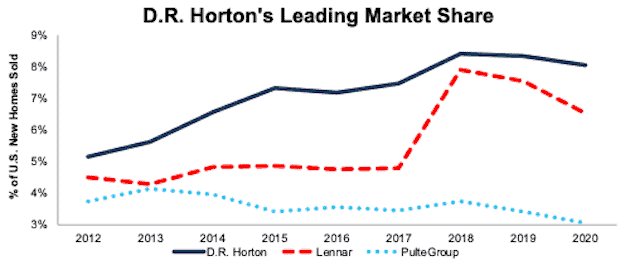
The three largest homebuilders by revenue Lennar (LEN), D.R. Horton, and PulteGroup (PHM) have all lost market share since 2018, though D.R. Horton’s market share declined the least. The homebuilder industry is dominated by small builders, and the rise in demand has enabled many of them to quickly grow revenue. While small businesses can quickly grow in good times, they are also vulnerable to financial distress in the bad times. The number of U.S. homebuilders fell 50%, from 98 thousand in 2007, to just 49 thousand in 2012.
Per Figure 2, D.R. Horton has a history of growing market share, which is up from 5% in 2012 to over 8% in 2020. With an 8% share of the U.S. new home market, D.R. Horton is the largest homebuilder.
Figure 2: D.R. Horton, Lennar & PulteGroup Market Share Since 2012
Sources: New Constructs, LLC, company filings, and Census Bureau.
D.R. Horton Is Growing Its Share of the Largest Segment of the Housing Market
The middle segment (prices from $200k to $500k) of the housing market is by far the largest and accounts for 75% of all homes sold. Inventory in the middle segment of the market remains in the highest demand. The National Association of Realtors’ chief economist noted that “homes priced above $250,000 have seen the “most active sales.”
As D.R. Horton grows its share of the middle segment of the housing market, it taps into the largest and fastest growing portion of the housing market. Per Figure 3, the company’s share of the middle segment has grown from 8% in 2017 to 10% in 2020.
Figure 3: D.R. Horton’s Share of U.S. Homes Sold by Price Point – 2017 & 2020
Sources: New Constructs, LLC, company filings, and Census Bureau.
D.R. Horton’s Scale Advantage
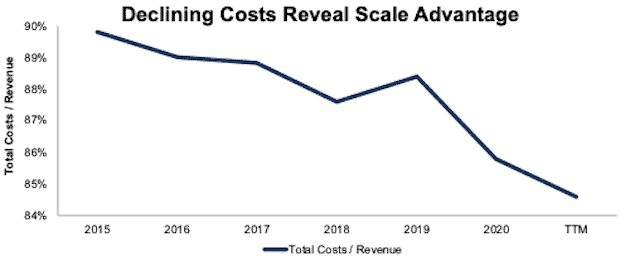
As the largest builder by volume, D.R. Horton is able to leverage relationships with its suppliers and contractors to negotiate volume discounts. Additionally, the firm is able to scale its selling, general and administrative operations across the country. Figure 4 illustrates the firm’s scale advantage that has resulted in total costs[1] as a percent of revenue declining from 90% in fiscal 2015 to 85% TTM.
Figure 4: D.R. Horton’s Total Costs / Revenue Since Fiscal 2015
Sources: New Constructs, LLC and company filings.
D.R. Horton’s scale also lowers its operational risk. By operating in 88 markets across 29 states, the firm limits its exposure to any one regional economic cycle and is able to more easily shift focus as demand shifts across the country.
Work From Home Provides a Long-Term Tailwind for All Homebuilders
The rise of work from home is likely the beginning of a long-term trend, with 83% of employers indicating they would have more flexible remote work policies after the pandemic. While many will want to be closer to urban areas to enjoy the amenities they provide after the pandemic is over, many others have, and will continue to, focus on where they want to live rather than where they need to live for employment.
Case in point: many urban dwellers left for the suburbs in 2020. Suburbs provide essential services, entertainment, and, perhaps more importantly, offer more affordable housing, a key selling point for work-from-home buyers and urban dwellers.
Downsizing Can Benefit D.R. Horton, Too
Before the pandemic, baby boomers expected to delay the typical downsizing stage of life until 2040. If baby boomers were reluctant before the pandemic, lock downs didn’t encourage many to move to a smaller living arrangement.
Even if baby boomers begin to downsize sooner than later, D.R. Horton stands to benefit since it holds such a large share of middle segment of the housing market. Many baby boomers will be downsizing into D.R. Horton’s target price range.
Concerns of Waning Demand After Pandemic & Low-Cost Substitutes Are Overstated
As the rise of vaccinations brings the hope of leaving the pandemic behind, many investors expect the surge in housing demand will subside. There is little evidence of such an impact yet, as the market continues to be supply constrained. As the NAR’s chief economist put it, “the demand for a home purchase is widespread, multiple offers are prevalent, and days on the market are swift.”
With the rise in home prices over the past year, investors may think manufactured homes, which offer a low-cost alternative for housing, will also eat away at demand for the single family home industry. However, the price advantage manufactured homes have over single family homes have not made them more popular over the past year. While the number of new single family houses sold rose 19% year-over-year in 2020, new manufactured home shipments remained unchanged from 2019.
Profitability Remains Best-in-Class
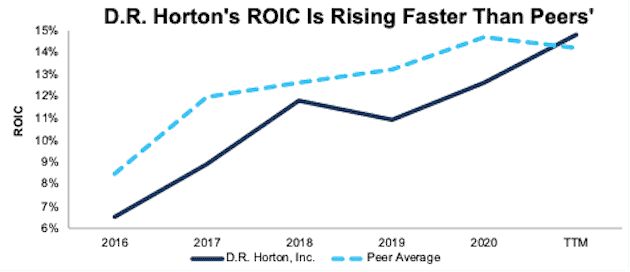
As mentioned above, D.R. Horton’s scale is a major competitive advantage that drives the firm’s superior profitability compared to peers. Per Figure 5, D.R. Horton’s return-on-invested capital (ROIC) rose from 6% in fiscal 2016 to 15% TTM.
Peers include other single family homebuilders including NVR Inc. (NVR), LGI Homes Inc (LGIH), Meritage Homes Corp (MTH), Green Brick Partners Inc (GRBK), M/I Homes, Inc. (MHO), PulteGroup Inc., MDC Holdings, Inc. (MDC), Lennar Corporation, Taylor Morrison Home Corp (TMHC), Hovnanian Enterprises, Inc. (HOV), KB Home (KBH), Tri Pointe Homes, Inc. (TPH), Toll Brothers, Inc. (TOL), and Beazer Homes USA, Inc. (BZH).
Figure 5: D.R. Horton vs. Peers: ROIC Since Fiscal 2016
Sources: New Constructs, LLC and company filings.
Taking a closer look at its two largest competitors further reveals D.R. Horton’s impressive profitability. D.R. Horton’s invested capital turns, a measure of balance sheet efficiency, best both PulteGroup and Lennar and its ROIC of 15% is far superior to PulteGroup’s 11% and Lennar’s 9%. See Figure 6.
Figure 6: Three Largest Homebuilders’ NOPAT Margin, IC Turns & ROIC (TTM)
Sources: New Constructs, LLC and company filings.
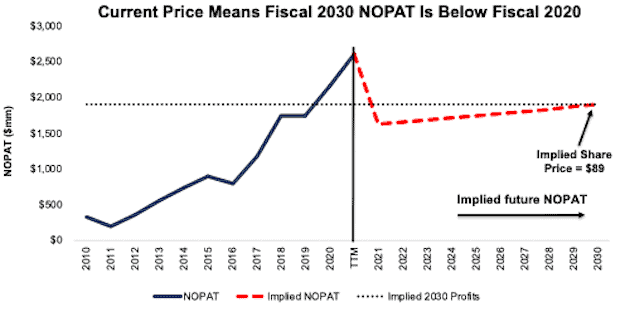
D.R. Horton’s Current Price Implies NOPAT Falls 27%
While some bears may argue that D.R. Horton will have difficulty meeting the record setting earnings comps over the last several quarters, its stock has already priced in a major decline in profits from TTM levels.
Our reverse discounted cash flow (DCF) model shows that to justify D.R. Horton’s current price of $89/share, the company will perform as follows:
- net operating profit after-tax (NOPAT) margin immediately falls to 8% (equal to 20-year average vs. 15% TTM) and
- revenue grows 2% compounded annually (vs. consensus estimates of 17% from fiscal 2021 - fiscal 2023) until fiscal 2030
In this scenario, D.R. Horton’s NOPAT falls 1% compounded annually over the next decade and is 27% below TTM levels. See the math behind this reverse DCF scenario. Figure 7 compares D.R. Horton’s implied NOPAT in this scenario to its historical NOPAT.
Figure 7: DCF Scenario 1: Historical vs. Implied NOPAT
Sources: New Constructs, LLC and company filings.
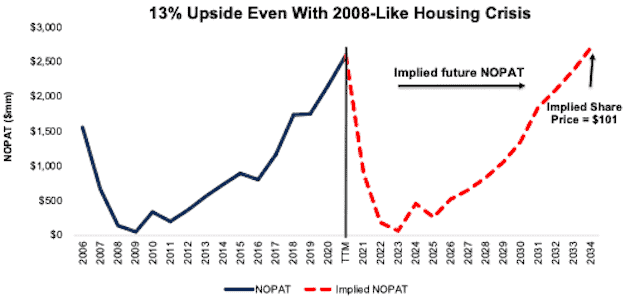
DHI Has 13% Upside Even if 2008 Repeats
While regulatory reforms to the mortgage industry make a repeat of the housing crisis of 2008 highly unlikely, we model a scenario that assumes the housing crisis repeats to demonstrate how negative the expectations baked into D.R. Horton’s stock price are. In this scenario, we assume D.R. Horton’s NOPAT margins and revenue growth match the firm’s historical NOPAT margin and revenue growth from 2007 to 2020. Specifically, we assume:
- NOPAT margin averages 7.3% from fiscal 2021-2034 (equal to 14-year average vs. 15% TTM) and
- revenue grows 2% compounded annually from fiscal 2021-2034 (equal 14-year compounded annual revenue growth)
In this scenario, D.R. Horton’s NOPAT grows just 2% compounded annually over the next 14 years and the stock is worth $101/share today – a 13% upside to the current price. See the math behind this reverse DCF scenario. Figure 8 compares D.R. Horton’s implied NOPAT in this scenario to its historical NOPAT.
Figure 8: DCF Scenario 2: Historical vs. Implied NOPAT
Sources: New Constructs, LLC and company filings.
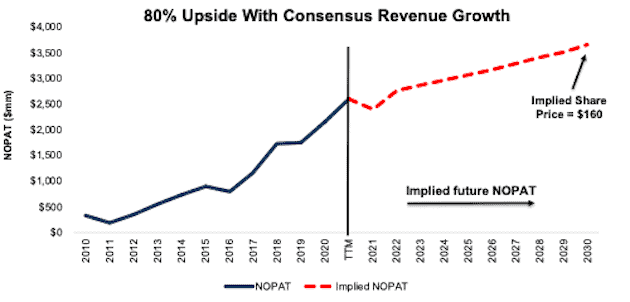
DHI Has 80% Upside If Revenue Simply Matches Consensus Estimates
If D.R. Horton’s revenue grows at consensus estimates, then D.R. Horton has huge upside. In this scenario, we assume:
- NOPAT margin falls to 9% (equal to five-year average vs. 15% TTM) and
- revenue grows 17% compounded annually from fiscal 2021-2023. (equal to consensus revenue estimates) and
- revenue grows by 3.5% (the average annual global GDP growth rate since 1961) compounded annually through fiscal 2030 then
the stock is worth $160/share today – an 80% upside. See the math behind this reverse DCF scenario. In this scenario, D.R. Horton’s NOPAT grows by just 5% compounded annually over the next decade. Over the last decade, the firm’s NOPAT grew 21% compounded annually (from fiscal 2010 to fiscal 2020). Figure 9 compares D.R. Horton’s implied NOPAT in this scenario to its historical NOPAT.
Figure 9: DCF Scenario 3: Historical vs. Implied NOPAT
Sources: New Constructs, LLC and company filings.
Sustainable Competitive Advantages Will Drive Shareholder Value Creation
Here’s a summary of why we think the moat around D.R. Horton’s business will enable it to continue to generate higher NOPAT than the current market valuation implies. The following competitive advantages also help D.R. Horton grow its market share over the long term:
- most profitable of the three largest (by revenue) U.S. homebuilders
- scale advantages over peers
- focused on the highest-growth area of the market
What Noise Traders Miss With D.R. Horton
These days, fewer investors focus on finding quality capital allocators with shareholder friendly corporate governance. Instead, due to the proliferation of noise traders, the focus is on short-term technical trading trends while more reliable fundamental research is overlooked. Here’s a quick summary of what noise traders are missing:
- historically low home inventory levels
- likelihood for interest rates to remain lower for longer
- valuation implies profits fall well below 2020 levels
Catalysts: A Consensus Beat & Low Interest Rates
At the end of March 2020, consensus earnings per share estimates for D.R. Horton’s fiscal 2021 were just $5.37. Jump forward to today, and consensus estimates have soared to $9.16/share. Investors’ fears of such high earnings expectations for 2021 have prevented the stock from going even higher than it already has over the past year. According to Zacks, D.R. Horton beat EPS estimates in 10 of the past 12 quarters and doing so again could send shares higher.
Furthermore, if home inventory levels remain low, investors could take notice and send shares higher.
Lastly, if fears of rising interest rates never materialize, the demand for new housing could last much longer than bears expect. With historically cheap mortgage rates enticing more and more buyers, more investors may decide to invest in this profitable and undervalued industry leader.
Dividends & Share Repurchases Could Provide a 1.7% Yield
Firms with cash flows greater than dividend payments have a higher likelihood to maintain and grow dividends.
D.R. Horton has increased its dividend in each of the past six years. Over the past six years, the firm generated more in in free cash flow ($2.8 billion) than it paid out in dividends ($1.0 billion), or an average $299 million surplus each year. Over the TTM, the firm has generated $440 million in FCF while paying out $264 million in dividends. Its last quarterly dividend, when annualized, equals $0.80/share and provides a 0.9% yield.
D.R. Horton also returns capital to shareholders through share repurchases. Since fiscal 2017, the firm repurchased $1 billion (3% of current market cap). D.R. Horton has $466 million remaining for future repurchases under its current authorization. If the firm repurchases shares in line with the TTM period, shareholders can expect a combined total yield 1.7% from buybacks and dividends.
Executive Compensation Could Be Improved
No matter the macro environment, investors should look for companies with executive compensation plans that directly align executives’ interests with shareholders’ interests. Quality corporate governance holds executives accountable to shareholders by incentivizing them to allocate capital prudently.
In fiscal 2020, D.R. Horton’s executives were compensated through a three-component plan that included cash, performance-based restricted stock units (RSUs), and time-based RSUs.
Cash bonuses were awarded based on the level of pre-tax income achieved by the company. Performance-based RSUs were awarded based on meeting four goals measured over a three-year period. These performance goals were relative total shareholder return, relative return on investment, relative selling, general and administrative expense, and relative gross profit.
We would prefer DHI tie performance compensation to improvement in ROIC, as there is a strong correlation between improving ROIC and increasing shareholder value. Tying executive compensation to ROIC also ensures that executives’ interests are properly aligned with shareholders’ interests.
Despite using different metrics, DHI’s plan has not compensated executives while destroying shareholder value. DHI grew economic earnings by 39% compounded annually over the past five years.
Insider Trading and Short Interest Trends
Over the past three months, insiders haven’t bought any shares and sold 55 thousand shares for a net effect of 55 thousand shares sold. These sales represent less than 1% of shares outstanding.
There are currently 6.2 million shares sold short, which equates to 2% of shares outstanding and less than two days to cover. Short interest is up 15% from the prior month. The low short interest indicates not many investors are willing to bet against this market-leading firm in a red-hot industry.
Critical Details Found in Financial Filings by Our Robo-Analyst Technology
Fact: we provide more reliable fundamental data and earnings models – unrivaled in the world.
Proof: Core Earnings: New Data & Evidence, forthcoming in The Journal of Financial Economics.
Below are specifics on the adjustments we make based on Robo-Analyst findings in D.R. Horton’s fiscal 2020 10-K and 1Q21 10-Q:
Income Statement: we made $235 million of adjustments, with a net effect of removing $214 million in non-operating income (1% of revenue). You can see all the adjustments made to D.R. Horton’s income statement here.
Balance Sheet: we made $6.6 billion of adjustments to calculate invested capital with a net increase of $1.3 billion. One of the largest adjustments was $3.9 billion in asset write-downs. This adjustment represented 26% of reported net assets. You can see all the adjustments made to D.R. Horton’s balance sheet here.
Valuation: we made $5.3 billion of adjustments with a net effect of decreasing shareholder value by $2.8 billion. Apart from total debt, one of the most notable adjustments to shareholder value was $1.3 billion in excess cash. This adjustment represents 4% of D.R. Horton’s market cap. See all adjustments to D.R. Horton’s valuation here.
Attractive Funds That Hold DHI
The following funds receive our Attractive-or-better rating and allocate significantly to DHI:
- iShares U.S. Home Construction ETF (ITB) – 14.1% allocation and Very Attractive rating
- Invesco Dynamic Building & Construction ETF (PKB) – 5.0% allocation and Very Attractive rating
- State Street SPDR S&P Homebuilders ETF (XHB) – 4.2% allocation and Very Attractive rating
- Smead Value Fund (SVFDX) – 3.2% allocation and Attractive rating
This article originally published on March 31, 2021.
Disclosure: David Trainer, Kyle Guske II, and Matt Shuler receive no compensation to write about any specific stock, style, or theme.
Follow us on Twitter, Facebook, LinkedIn, and StockTwits for real-time alerts on all our research.
[1] Total Costs = Cost of Sales + Selling, general and administrative expense



3 replies to "Built to Profit From Long-Term Tailwinds"
What version of yours does TD Ameritrade have?
John,
Clients of TD Ameritrade can access abbreviated reports and our ratings on over 10,000 stocks, mutual funds, and exchange-traded funds (ETFs) directly from their TD Ameritrade accounts. More details here.
Can you share the range of EBV to stock price your analysis considers very attractive? Or is it more nuanced taking growth into account?