All too often, a company engaging in an acquisitional approach to growing a business is doing so to hide weaknesses in the fundamentals of the corporation. However, there are firms engaging in acquisitions that create true shareholder value. This week’s Long Idea, Thor Industries (THO: $65/share), has expanded through quality acquisitions, yet remains undervalued by the market at large. With a history of profit growth and beneficial trends in the recreational vehicle industry, Thor Industries makes an excellent addition to one’s portfolio.
History of Impressive Revenue & Profit Growth
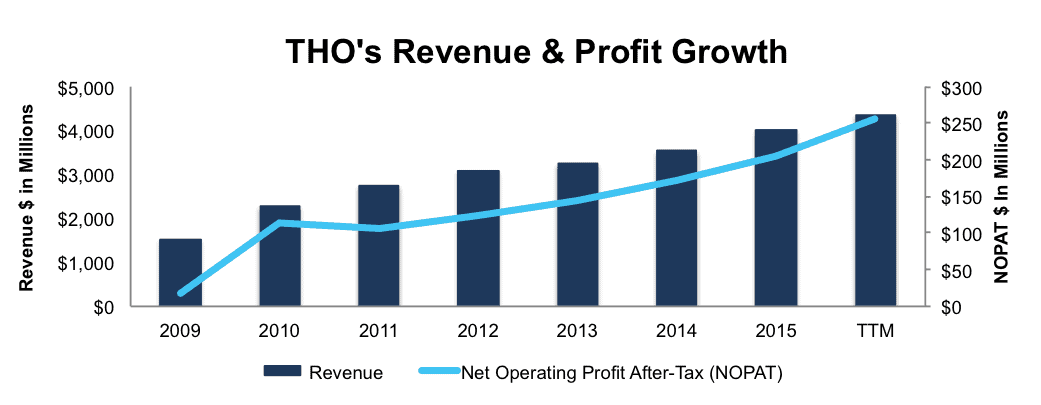
Thor Industries has built a leading business in the recreational vehicle market throughout its history. Since 2009, Thor’s after-tax profit (NOPAT) has grown by an impressive 50% compounded annually to $205 million in 2015 and $256 million over the trailing twelve months. See Figure 1. Since 1998, the company has grown NOPAT by 14% compounded annually.
Figure 1: Revenue Growth Leads To Profit Growth
Sources: New Constructs, LLC and company filings
Despite multiple acquisitions, which often destroy shareholder value, Thor’s ROIC has improved from 3% in 2009 to a top-quintile 22% over the last-twelve months. This improvement in ROIC is a testament to management’s ability to find truly accretive acquisitions and effectively deploy the capital invested in the business.
Further showcasing the strength of Thor’s operations, the company generated $239 million in cumulative free cash flow (FCF) over the last five years.
No Misleading Non-GAAP Metrics
In many of our Danger Zone reports, we highlight how non-GAAP metrics can be used to create an illusion of profitability when the economics of the business are deteriorating. However, in the case of Thor Industries, management has made the prudent decision to avoid non-GAAP metrics and only report their earnings in accordance with GAAP. While GAAP is by no means perfect, the decision to forego non-GAAP metrics is a plus.
Operating In A Profitable Industry: Recreational Vehicles
Thor Industries manufactures a wide range of RV’s under brands including Airstream, Thor Motor Coach, Keystone RV, and Crossroads RV. These products fall into two categories, towable and motorized. Within these specialized markets, Thor faces competition from two main competitors, Winnebago (WGO) and Forest River, which is a subsidiary of Berkshire Hathaway. Relative to Winnebago, Thor Industries has a higher NOPAT margin and ROIC, as can be seen in Figure 2. In addition to higher profitability, Thor is the leader in market share of motorized RV’s and #2 in towable, behind Forest River.
Figure 2: Thor’s Strong Profitability
Sources: New Constructs, LLC and company filings.
Bear Concerns Are Overblown
The largest bear concern regarding Thor Industries is more a reflection of expectations for an economic decline. Because Thor is selling discretionary products like recreational vehicles, many fear that a weak economy would send THO reeling from its current price. This fear is more short sighted and is not something that should be of concern for long-term investors, given Thor’s ability to remain profitable during the last recession.
In 2008-2009, Thor’s NOPAT declined drastically, from $98 million in 2008 to $18 million in 2009. However, the rebound in profits was not only quick, but also more dramatic than the fall. As soon as 2010, NOPAT had increased to $113 million, surpassing the NOPAT earned in 2008. Additionally, only five years later, in 2015, Thor Industries’ profits had surpassed its previous peak achieved in 2006. It should be worth noting that Thor’s management makes a point to state they have been profitable in every year since founding, which occurred in 1980.
While its clear that a recession would certainly harm Thor in the short-term, the company has a proven track record. Better yet, fears of a recession may be overblown. In May 2016, The Federal Reserve Bank of Atlanta’s wage tracker, which tracks year-over-year median wage growth, hit its highest levels since 2009. At the same time in May, the unemployment rate, as tracked by the Bureau of Labor Statistics, reached its lowest point since 2007.
Apart from Thor’s ability to bounce back from an economic downturn, the current trends in the industry don’t indicate an imminent downturn, as bears would suggest. In fiscal year 2015, Thor’s vehicles sold grew 14% over 2014. More recently, in fiscal 1Q16, 2Q16, and 3Q16, vehicles sold grew 10%, 10%, and 6% respectively. Industry wide, the recreation vehicle industry association (RVIA) projects wholesale shipments of RV’s to increase 6% in 2016, year-over-year. Despite economic metrics improving, and steady growth occurring within the RV industry, THO remains significantly undervalued, as we’ll show below.
Current Valuation Ignores Thor’s Profitability
Despite the strength of Thor’s business, the stock is up only 13% over the past year and THO’s current valuation represents an attractive buying opportunity. At its current price of $65/share, Thor has a price to economic book value (PEBV) ratio of 1.1. This ratio means that the market expects Thor to grow its NOPAT by only 10% for the remainder of its corporate life. This expectation runs contrary to the profit growth achieved throughout Thor’s history.
If Thor can maintain TTM NOPAT margins (5.9%) and grow NOPAT by just 8% compounded annually for the next decade, the stock is worth $86/share today – a 32% upside. Since 1998, Thor has grown NOPAT by 14% compounded annually. This scenario also assumes that Thor’s spending on working capital and fixed assets will be 2% of revenue, which is the average change in invested capital over the past decade.
Dividend Provides Extra Yield
Apart from being undervalued, THO also pays a $0.30 quarterly dividend, which at current share price of $65/share provides a dividend yield nearing 2%. As it stands, THO has no ongoing share repurchase program.
Improved Economy Will Spur Earnings Beat
Continued economic improvement could spur Thor Industries to new highs. Because it operates in the consumer discretionary sector, it is dependent upon a strong consumer to continue growing profits. Per above, the economy continues to improve, even if slowly, as unemployment continues falling and consumer confidence remains near pre recession highs. These factors all add up to the potential for increased RV usage, especially for camping, which as reported by KOA, only 22% of campers use RV’s. This low usage presents untapped market potential and in a growing economy, Thor can use its industry experience, leading profitability, and quality acquisitions to continue growing profits.
Insider Trends/ Short Sales Raise No Red Flags
Over the past 12 months, insiders have purchased ~56,000 shares and sold ~26,000 shares for a net effect of ~30,000 insider shares sold. This amount represents less than 1% of shares outstanding. Additionally, short interest sits at 2.8 million shares, or just above 5% of shares outstanding.
Executive Compensation Passes The Test
Thor Industries’ executives receive annual incentives and long-term incentives (restricted stock units) for achieving one goal, net profit before tax. It is encouraging to see the executive compensation plan ignore non-GAAP metrics that can easily be manipulated to earn short-term bonuses. In fact, in the most recent proxy statement, the compensation committee noted “We guard aggressively against any short-term management thinking that could detract from long-term performance.” Since there is a clear correlation between ROIC and shareholder value creation, we would prefer THO’s compensation plan focus on ROIC, but as it stands, Thor’s compensation plan could certainly be worse.
Impact of Footnotes Adjustments and Forensic Accounting
In order to derive the true recurring cash flows, an accurate invested capital, and a real shareholder value, we made the following adjustments to Thor Industries 2015 10-K:
Income Statement: we made $10 million of adjustments with a net effect of removing $6 million in non-operating expenses (<1% of revenue). We removed $8 million related to non-operating expenses and $2 million related to non-operating income. See all adjustments made to THO’s income statement here.
Balance Sheet: we made $289 million of adjustments to calculate invested capital with a net decrease of $123 million. The most notable adjustment was $134 million (12% of net assets) related to midyear acquisitions. See all adjustments to THO’s balance sheet here.
Valuation: we made $41 million of adjustments with a net effect of increasing shareholder value by $19 million. One of the largest adjustments was $30 million due to excess cash. This adjustment represents <1% of THO’s market cap.
Attractive Funds That Hold THO
The following funds receive our Attractive-or-better rating and allocate significantly to Thor Industries.
- DGHM All-Cap Value Fund (DGACX)– 3.1% allocation and Attractive rating
- ValueShares US Quantitative Value ETF (QVAL) – 2.6% allocation and Very Attractive rating
- Fidelity Select Air Transportation Portfolio (FSAIX) –3.2% allocation and Attractive rating.
This report originally published here on June 23, 2016.
Disclosure: David Trainer and Kyle Guske II receive no compensation to write about any specific stock, style, or theme.
Click here to download a PDF of this report.
Photo Credit: drip&ju (Flickr)


