Our proven-superior research[1] earned us #1 rankings – again – on SumZero for March 2025.
For 45 consecutive months since May 2021, our stock picks have ranked #1 in multiple categories. 45 consecutive months of superior stock picking is no small feat, especially across so many categories:
- #1 in Consumer Discretionary
- #1 in Industrials
- #2 in Consumer Staples
- #5 in Micro Cap
- #6 in Long
- #10 in Healthcare
Our SumZero stock picks come from our Focus List Stocks: Long and Focus List Stocks: Short Model Portfolios, which feature our best stock picks.
From January 2021 through 2024, the Focus List Stocks: Long Model Portfolio has outperformed the S&P 500[2] by 15%, and the Focus List Stocks: Short Model Portfolio has outperformed shorting the S&P 500 by 41%.
Get the latest Focus List Stocks: Long here and Short here.
Professional members get updates to the Focus Lists in real time and get our research before syndication to SumZero and other platforms.
SumZero is an exclusive buy-side community with over 16,000 pre-screened professional portfolio managers that compete for these rankings.
Figure 1: Performance of Select Long Ideas on SumZero – Through 3/5/25*
| Company | Ticker | Publish Date | Outperformance Vs. S&P 500 |
| AutoZone Inc. | AZO | 11/4/20 | 148% |
| HCA Healthcare | HCA | 6/22/20 | 140% |
| JPMorgan Chase | JPM | 5/21/20 | 90% |
| D.R. Horton | DHI | 4/27/20 | 81% |
| Allison Transmission | ALSN | 6/15/20 | 73% |
Sources: New Constructs, LLC
*Performance on a price return basis, exclusive of dividends.
Figure 2: Performance of Select Danger Zone Picks on SumZero – Through 3/5/25*
| Company | Ticker | Publish Date | Outperformance as a Short Vs. S&P 500 |
| Eventbrite | EB | 9/24/18 | 192% |
| Lyft Inc. | LYFT | 3/12/19 | 191% |
| Peloton Interactive | PTON | 9/21/20 | 168% |
| Beyond Meat | BYND | 9/2/20 | 176% |
| AMC Entertainment | AMC | 4/12/21 | 137% |
Sources: New Constructs, LLC
*Performance on a price return basis, exclusive of dividends.
Check Out the Indices Based on New Constructs Research
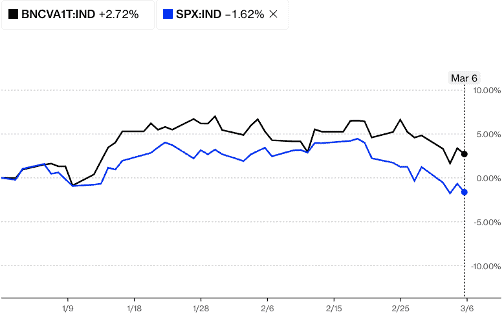
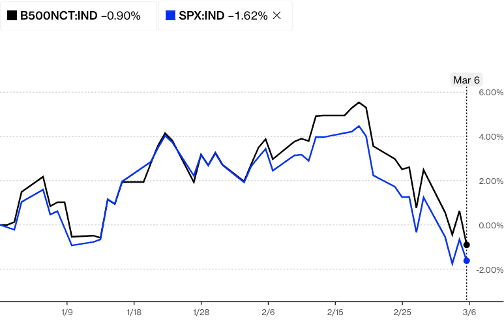
While we’re writing about how our superior fundamental research finds winning stocks, we should highlight the indices we’ve developed with Bloomberg’s Index Licensing Group. Both are outperforming the S&P 500 this year. See Figures 3 and 4.
- Bloomberg New Constructs 500 Index (ticker: B500NCT:IND)
- Bloomberg New Constructs Ratings VA-1 Index (ticker: BNCVA1T:IND).
Figure 3 compares the performance of the Very Attractive Stocks Index, managed by Bloomberg, to the S&P 500. Since January 1, 2025, the Bloomberg New Constructs Ratings VA-1Index (ticker: BNCVAT1T:IND) is up 2.7% while the S&P 500 is down 1.6%.
Figure 3: Very Attractive-Rated Stocks Strongly Outperform the S&P 500 Year to Date
Sources: Bloomberg
Note: Past performance is no guarantee of future results.
Figure 4 compares the performance of the Bloomberg New Constructs 500 Total Return Index, managed by Bloomberg, to the S&P 500. Since January 1, 2025, the Bloomberg New Constructs 500 Total Return Index (ticker: BNCVAT1T:IND) is down 0.9% while the S&P 500 is down 1.6%.
Figure 4: Bloomberg New Constructs 500 Index Strongly Outperforms the S&P 500 Year to Date
Sources: Bloomberg
Note: Past performance is no guarantee of future results.
This article was originally published on March 6, 2025.
Disclosure: David Trainer owns DHI. David Trainer, Kyle Guske II, and Hakan Salt receive no compensation to write about any specific stock, style, or theme.
Questions on this report or others? Join our online community and connect with us directly.
[1] The Journal of Financial Economics features the superiority of our Core Earnings in Core Earnings: New Data & Evidence.
[2] Stocks are in the Focus List Model Portfolios for different periods of time as we open and close positions during the year. When measuring outperformance of the Focus List Model Portfolios, we compare each stock’s return to the S&P 500’s return for the time each is in the Focus List Model Portfolios. This approach provides more of an apples-to-apples comparison of how each stock performed vs. the S&P 500.


