We published an update on this Long Idea on February 23, 2022. A copy of the associated Earnings Update report is here.
Check out this week’s Danger Zone Interview with Chuck Jaffe of Money Life.
Our last Long Idea highlighted how commitments to infrastructure spending create lasting demand for MasTec Inc.’s (MTZ’s) business. The same is true for this automatic transmission manufacturer, which supplies essential vehicles such as box trucks, school buses, fire trucks, city buses, and garbage trucks. This firm has dominated the medium- and heavy-duty truck market for years with a reputation for high-quality and reliable products.
However, short-term COVID-19-related decline in customer demand has many investors overlooking this best-in-class commercial vehicle parts supplier. Investors looking past Allison Transmission Holdings Inc (ALSN: $37/share) are in the Danger Zone. We think there’s great value to be had in this Long Idea.
Allison’s History of Profit Growth
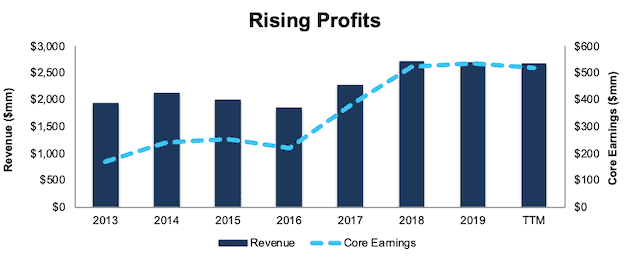
Allison has a strong history of profit growth. Over the past five years, Allison has grown revenue by 5% compounded annually and core earnings[1] by 17% compounded annually, per Figure 1. Longer term, Allison has grown core earnings by 21% compounded annually since 2013. The firm increased its core earnings margin from 9% in 2014 to 19% in the trailing-twelve-month period (TTM).
Figure 1: Core Earnings & Revenue Growth Over the Past Decade
Sources: New Constructs, LLC and company filings.
Allison’s rising profitability helps the business generate significant free cash flow (FCF). The company generated a cumulative $2.5 billion (93% of market cap) in positive FCF over the past five years. Allison’s $295 million in free cash flow over the TTM period equates to a 4% FCF yield, which is higher than the Industrials sector average of 2%.
Ample Liquidity to Survive the Downturn
COVID-19 has disrupted Allison’s customer demand and global supply chains and will certainly lead to lower sales in the short term.
Even so, Allison’s available liquidity positions it to weather the economic downturn. At the end of 1Q20, the firm had ~$709 million in cash on hand and available credit. The firm distributed $19 million back to shareholders in its most recent dividend payment. Allison also has a very favorable debt structure, with the earliest maturity in September 2024.
In a worst-case scenario, where Allison generates no revenue, the firm could operate for over 11 months with its available liquidity before needing additional capital. This scenario assumes Allison maintains spending at current levels, including general and administrative expenses, research and development expenses, interest and other expenses ($145 million in 1Q20) and the remaining targeted capex ($112 million for 2020).
However, it’s highly unlikely that Allison’s revenue would go to zero given the essential nature of its business. The firm generated $637 million in revenue in 1Q20, which included the first few weeks of the many stay-at-home orders issued across the country. Furthermore, management noted in its 1Q20 10-Q that “the majority of our plants are continuing to operate as essential businesses.”
Superior Profitability Helps Take Market Share During the Crisis and Grow in the Recovery
COVID-driven disruptions to the medium- and heavy-duty truck industry may drive weaker operators out of business for good. However, Allison’s profitability was superior to its competitors before the crisis, and the firm is well-positioned to grow profits when the economy recovers.
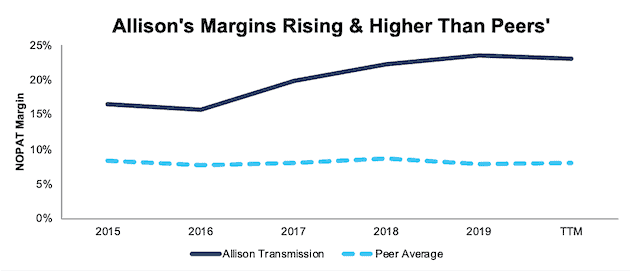
Per Figure 2, Allison’s net operating profit after-tax (NOPAT) margin has improved from 17% in 2015 to 23% TTM. Over the same time, the market-cap-weighted average of 32 other Auto, Truck & Motorcycle Parts firms has declined from 8.1% in 2015 to 7.6% TTM. Allison’s peer group includes Johnson Controls International (JCI), Cummins Inc. (CMI), Aptiv, PLC (APTV), Magna International Inc. (MGA) and more.
Figure 2: NOPAT Margin Vs. Peers
Sources: New Constructs, LLC and company filings.
While below its peer group’s market-cap-weighted average, Allison’s invested capital turns, a measure of balance sheet efficiency, have improved from 0.47 in 2015 to 0.66 TTM, per Figure 3. On the other hand, the peer group’s market-cap-weighted average invested capital turns have fallen from 1.88 to 1.38 over the same time.
Figure 3: Invested Capital Turns Vs. Peers

Sources: New Constructs, LLC and company filings.
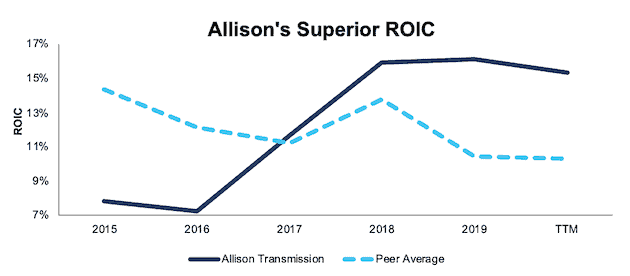
The combination of rising margins and improving invested capital turns drive Allison’s leading return on invested capital (ROIC). Per Figure 4, Allison’s ROIC has improved from 8% in 2015 to 15% TTM while the market-cap- weighted average of peers’ ROIC has fallen from 15% to 10% over the same time.
Figure 4: ROIC vs. Peers
Sources: New Constructs, LLC and company filings.
Unless you believe that there will be no need for automatic transmissions in a post-COVID-19 world, it’s hard to argue against Allison’s ability to survive. And, if it survives, it’s hard to argue that the firm’s superior profitability before the crisis will not translate into market share and profit growth after the crisis.
Allison Has a Strong Core Business…
Allison manufactures nearly 60% of the global market share of fully-automatic transmissions for medium- and heavy-duty commercial vehicles. Allison’s sales to the North American on-highway segment of class 4-8 trucks provides the firm with its long-term core business. However, the medium- and heavy- duty truck industry is very cyclical.
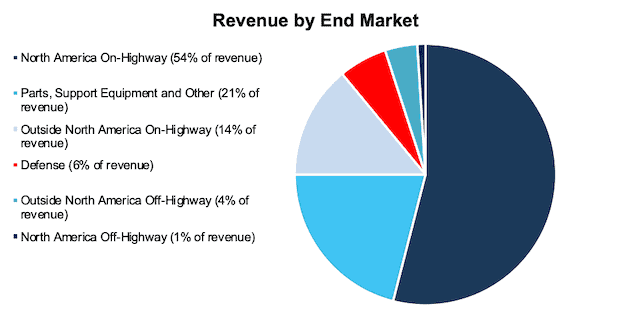
Despite the challenges of the cyclical nature of its business, the firm has been able to generate positive FCF in each year since its IPO. One of the ways the firm has managed its consistent FCF generation is by targeting a large number of Municipal customers which are traditionally less reactive to market fluctuations. Municipal spending accounts for 30% to 40% of the firm’s North American on-highway market volume. These consistent customers help reduce Allison’s overall end-market volatility. Figure 5, shows that Allison generates 54% of its revenue from the North American on-highway segment.
Allison’s use of long-term agreements (LTAs) further smooths out its cash flows and minimizes volatility. Customers accounting for 95% of Allison’s 2019 North American on-highway unit volume were a part of LTAs, usually three to five years long. Not only do these LTAs reduce set-up costs and enhance production efficiencies, they also help deepen and strengthen the relationship the firm has with its customers. Additionally, many of these LTAs incorporate cost-sharing arrangements that allow Allison to hedge its risk to sudden changes in commodity prices by passing on a portion of the change in costs to its end customers.
Figure 5: North America On-Highway Accounts for 54% of Allison’s Revenue – TTM
Sources: New Constructs, LLC and Investor Relations.
…That Is Positioned to Partake in the Recovery
The COVID-19 pandemic is having an adverse impact on Allison’s business in the short term, as customers delay orders and suppliers fail to meet their obligations. But, Allison’s dominant position in a variety of segments within the North American on-highway market allows the firm to grow profits during any economic recovery. For example, Figure 6 shows that Allison supplied 84% of the transmission orders for U.S. school buses over the TTM.
Figure 6: Allison’s Share of the North American On-Highway Market

Sources: New Constructs, LLC and Investor Relations.
While short-term expectations for North American commercial vehicle demand have soured, ACT research, a leading publisher of commercial vehicle industry data, believes “longer-term assumptions are unchanged presently, with expectations that markets will recover to trend starting in 2022.” In fact, the heavy-duty commercial segment (Class 5 and above) is expected to grow 5.35% compounded annually from 2020 to 2025.
We believe a recovery is likely over the long term since the International Monetary Fund (IMF) and nearly every economist in the world believe the global economy will grow strongly in 2021. The IMF estimates the global economy will expand by 5.8%, and the U.S. economy by 4.7%, in 2021. Fitch Ratings projects global GDP growth of 5.1% in 2021, and for “pre-virus levels of GDP” to be reached in mid-2022 in the US and later in Europe. The overall growth in the economy should lead to a rebound in capital expenditures, which present plenty of opportunities for Allison to increase its market share.
Bear Case: EVs Make Allison Obsolete – or Do They?
Much has been made of electric vehicles (EVs) disrupting the automobile industry. Just recently, Tesla confirmed that it was moving forward with plans to bring Class 8 semi-trucks to volume production. Given that EVs do not need transmissions, many interpret this as very bad news for Allison.
However, electric trucks are expected to make up 9.4% of the medium- and heavy-duty truck market by 2030. While that is a significant amount ten years from now, there will still be over 90% of the market for diesel and gasoline powered trucks, which Allison has been serving with automatic transmissions with expertise for decades.
Allison offers a strong value proposition to its customers, which maintains demand for its products. Automatic transmissions are typically more reliable than manual transmissions and result in lower long-term maintenance costs. Additionally, automatic transmissions increase fuel efficiency and require a lower level of skill to operate than manual transmissions.
While the labor shortage for U.S. truck drivers is expected for many years, automatic transmissions allow companies to lower labor costs by sourcing drivers from a larger, but lower-skilled, labor pool. Allison estimates that the payback period for a premium Allison Transmission averages less than three years. After reaching the payback period, operators can expect many years of significant cost savings given that the average age of class 4-8 trucks is between 11 and 17 years.
Allison still has plenty of growth opportunities within its core business as well. The longstanding preference for manual transmissions for Class 8 semi-trucks has hampered the firm’s ability to more effectively expand in that market. However, over the past five years, those customer preferences have changed, and automatic transmissions now make up the majority of the Class 8 market.
With only a 7% share of the Class 8 Metro market presently, Allison can continue to leverage its quality and experience to grow in this market. For example, the firm announced in October 2019 a new transmission in partnership with Freightliner Trucks, a division of Daimler AG (DMLRY) and the leading commercial vehicle manufacturer in North America, which will address the needs of Food and Beverage customers in the Class 8 Metro market.
Allison also has the ability to expand its market share in other segments as well. Chevrolet, Navistar, and Isuzu have all recently launched class 4-5 trucks that exclusively use Allison transmissions. The all-new Mack MD Series line of class 6-7 trucks are also exclusively equipped with Allison transmissions.
EV Is an Opportunity Too
The market for medium- and heavy-duty electric vehicles is expected to grow by 9% compounded annually from 2018 to 2030. This growth provides Allison with an opportunity to expand its business.
Allison is already investing in the future that includes EV. The firm expects to complete its new environment innovation center in early 2021. This facility will enhance the firm’s capabilities to develop, manufacture, and quickly bring to market its latest propulsion innovations and solutions for the global commercial vehicle and defense market.
With its eye on the future, Allison has already introduced its new e-axle propulsion system that is designed to fit in a standard Class 6-8 frame. Successfully implementing this technology into the greater commercial EV market will provide Allison with additional growth opportunities.
The firm’s electric innovation is not just limited to future possibility. Allison has already proven its capabilities in this space with ~9,000 electric hybrid propulsion systems delivered for use in transit buses with over 2.2 billion miles of operation since 2003.
With its history of quality and long-standing relationships, Allison is prepared to supply the next generation of medium- and heavy-duty vehicles, whether it be through traditional means, or electric.
ALSN Trades at Cheapest Level in a Decade
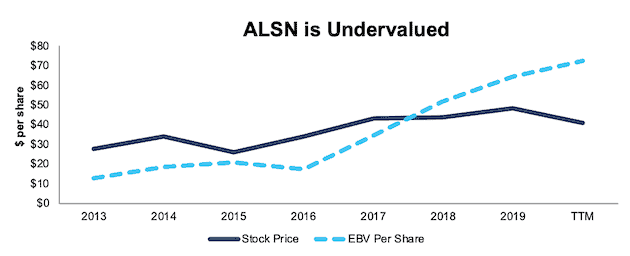
After falling 22% year-to-date (YTD) to $37/share, ALSN now trades significantly below its economic book value, or no-growth value, and at its cheapest price-to-economic book value (PEBV) ratio (0.5) in the history of our model. This ratio means the market expects Allison’s NOPAT to permanently decline by 50%. This expectation seems overly pessimistic over the long term. For reference, Allison has grown NOPAT by 16% compounded annually since 2013.
Allison’s current economic book value is $76/share – a 105% upside.
Figure 7: Stock Price vs. Economic Book Value (EBV)
Sources: New Constructs, LLC and company filings.
ALSN’s Current Price Implies No Economic Recovery
Despite consensus estimates for year-over-year (YoY) revenue growth in 2021 and 2022, ALSN is priced as if the COVID-driven economic decline is permanent. Below, we use our reverse DCF model to quantify the cash flow expectations baked into Allison’s current stock price. Then, we analyze the implied value of the stock based on different assumptions about COVID-19’s impact on the economy and Allison’s future growth in cash flows.
Scenario 1: Using historical revenue declines, historical margins, and average historical GDP growth rates, we can model the worst-case scenario already implied by Allison’s current stock price. In this scenario, we assume:
- NOPAT margins fall to 13% (lowest since 2013, compared to 23% TTM) in 2020-2022 and increase to 18% (average since 2013) in 2023 and each year thereafter
- Revenue falls 30% (in-line with estimates for heavy-duty truck sales) in 2020 and does not grow in 2021 or 2022 (vs consensus estimates of 15% and 10%)
- Sales begin growing again in 2023, but only at 3.5% a year, which is the average global GDP growth rate since 1961
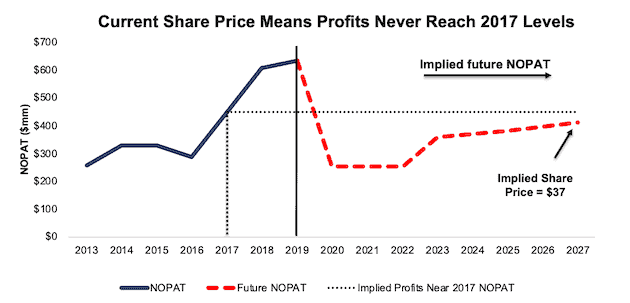
In this scenario, where Allison’s NOPAT declines 5% compounded annually over the next eight years (including a 60% YoY drop in 2020), the stock is worth $37/share today – equal to the current stock price. See the math behind this reverse DCF scenario.
For reference, the last time class 5 and higher truck retail sales fell YoY in 2016, Allison’s NOPAT declined by 12% YoY before increasing by 56% YoY in 2017.
Figure 8 compares the firm’s implied future NOPAT to its historical NOPAT in this scenario. This worst-case scenario implies Allison’s NOPAT eight years from now will be 35% below its 2019 NOPAT. In other words, this scenario implies that eight years after the COVID-19 pandemic, Allison’s profits will have only recovered to 9% below 2017 levels. In any scenario better than this one, ALSN holds significant upside potential, as we’ll show below.
Figure 8: Current Valuation Implies Severe, Long-Term Decline in Profits: Scenario 1
Sources: New Constructs, LLC and company filings.
Scenario 2: Long-term View Could Be Very Profitable
If we assume, as does the IMF and nearly every economist in the world, that the global economy rebounds and returns to growth starting in 2021, ALSN is undervalued.
In this scenario, we assume:
- NOPAT margins fall to 13% (lowest since 2013, compared to 23% TTM) in 2020 and increase to 20% (three-year low) in 2021 and each year thereafter
- Revenue falls 30% (in-line with estimate for heavy-duty truck sales) in 2020, and grows by 5.8% in 2021 (in-line with IMF global GDP expectations vs consensus estimate of 15%)
- Sales grow at 3.5% a year thereafter, which is the average global GDP growth rate since 1961
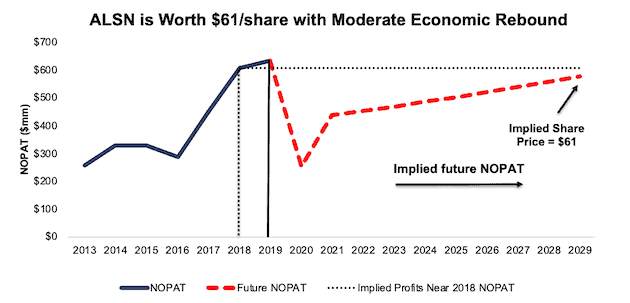
In this scenario, Allison’s NOPAT falls by 1% compounded annually over the next decade (including a 60% YoY drop in 2020) and the stock is worth $61/share today – a 69% upside to the current price. See the math behind this reverse DCF scenario.
For comparison, Allison has grown NOPAT by 14% compounded annually over the past five years. It’s not often investors get the opportunity to buy an industry leader at such a discounted price.
Figure 9 compares the firm’s implied future NOPAT to its historical NOPAT in scenario 2. This moderate scenario implies that a decade from now, Allison’s NOPAT will still be 5% below 2018 levels. If the firm simply grows in-line with consensus, and profits return to these levels in less than 10 years, ALSN has even more upside potential.
Figure 9: Implied Profits Assuming Moderate Recovery: Scenario 2
Sources: New Constructs, LLC and company filings.
Sustainable Competitive Advantages Will Drive Shareholder Value Creation
Here’s a summary of why we think the moat around Allison’s business will enable it to continue to generate higher NOPAT than the current market valuation implies. The following competitive advantages help Allison survive the downturn and return to growth as the economy grows again:
- Strong balance sheet to survive the dip
- World’s largest manufacturer of fully-automatic transmissions for medium- and heavy-duty commercial vehicles
- Strong value proposition that earns premium pricing
- Superior profitability to its peer group
What Noise Traders Miss with Allison
These days, fewer investors focus on finding quality capital allocators with shareholder friendly corporate governance. Instead, due to the proliferation of noise traders, the focus is on short-term technical trading trends while high-quality fundamental research is overlooked. Here’s a quick summary of what noise traders are missing:
- Opportunity to increase market share with underserved Class 4-5 and Class 8 Metro segments
- The firm’s investment in EV technology
- Valuation implies the economy never recovers
Nearly 2% Dividend Yield
Allison recently paid a $0.17/share dividend and in its 1Q20 earnings call noted “We remain committed to our capital allocation priorities including the return of capital to shareholders.”
In the last five years, the firm has generated far more in in free cash flow ($2.5 billion) then it has paid out in dividends ($448 million), or an average $405 million surplus each year. Its latest quarterly dividend, when annualized, equaled $0.68/share, and provides a 1.8% yield.
Historically, Allison has also returned capital to its shareholders through share repurchases. Allison has repurchased $3.0 billion (64% of current market cap) since 2015.
As of March 31, 2020, the firm had $872 million (19% of current market cap) remaining for future repurchases under its current authorization. Should the firm exhaust its repurchase authorization, it would provide additional yield for investors willing to look through the current economic uncertainty.
A Consensus Beat or Signs of Recovery Could Send Shares Higher
According to Zacks, consensus estimates at the end of January pegged Allison’s 2020 EPS at $4.51/share. Jump forward to June 12, and consensus estimates for Allison’s 2020 EPS have fallen to $2.58/share. 2021 estimates follow a similar trend. At the end of January, 2021 EPS consensus was $4.44/share, which has since fallen to $3.70/share.
Though the COVID shutdowns delay customer orders and disrupt Allison’s supply chain, these lowered expectations provide a great opportunity for a strong business, such as Allison, to beat consensus, if not this quarter, then maybe the next. Though our current Earnings Distortion Score, which is a short-term indicator of the likelihood to beat or miss expectations, for Allison is “Miss”, lowered expectations moving forward could make it much easier to beat earnings.
The firm beat EPS estimates in each of the past 15 quarters, and doing so again, in the midst of such market turmoil, could send shares higher.
Lastly, any signs of a recovery in the global economy would send shares higher.
Executive Compensation Could Be Improved but Raises No Red Flags
No matter the macro environment, investors should look for companies with executive compensation plans that directly align executives’ interests with shareholders’ interests. Quality corporate governance holds executives accountable to shareholders by incentivizing them to allocate capital prudently.
In 2019, ~78% of executive compensation was tied to financial performance and/or the performance of the firm’s stock price. The firm’s performance measures were based on adjusted EBITDA as a percent of net sales, adjusted free cash flow, and revenue.
We would prefer the firm use ROIC improvement when determining executive compensation, as there is a strong correlation between improving ROIC and increasing shareholder value. Having accurate values for NOPAT and invested capital ensures investors have an apples-to-apples metric for measuring corporate performance and holds management accountable for every dollar invested into the company.
Beyond compensation, the CEO is obligated to hold stock valued at a minimum of five times his salary. NEO’s are required to hold stock valued at three times their salaries, while other key employees are required to hold stock valued at one-and-a-half times their salaries.
Despite not using ROIC when measuring performance, and instead focusing on a flawed metric in adjusted EBITDA, Allison’s compensation plan has not compensated executives while destroying shareholder value. Allison has grown economic earnings by 35% compounded annually over the past five years and 49% compounded annually since 2013.
Insider Trading and Short Interest Trends
Over the past twelve months, insiders have bought a total of 16 thousand shares and sold 81 thousand shares for a net effect of 65 thousand shares sold. These purchases represent less than 1% of shares outstanding.
There are currently 3.2 million shares sold short, which equates to 3% of shares outstanding and over two days to cover. Short interest is down 5% from the prior month. The low and declining short interest indicates few investors have an appetite to bet against this best-in-class performer.
Critical Details Found in Financial Filings by Our Robo-Analyst Technology
As investors focus more on fundamental research, research automation technology is needed to analyze all the critical financial details in financial filings as shown in the Harvard Business School and MIT Sloan paper, "Core Earnings: New Data and Evidence”.
Below are specifics on the adjustments we make based on Robo-Analyst findings in Allison’s 2019 10-K:
Income Statement: we made $258 million of adjustments, with a net effect of removing $30 million in non-operating expenses (1% of revenue). You can see all the adjustments made to Allison’s income statement here.
Balance Sheet: we made $1.2 billion of adjustments to calculate invested capital with a net decrease of $155 million. One of the largest adjustments was $770 million in deferred tax assets. This adjustment represented 19% of reported net assets. You can see all the adjustments made to Allison’s balance sheet here.
Valuation: we made $3.2 billion of adjustments with a net effect of decreasing shareholder value by $3.1 billion. Apart from $2.6 billion in total debt and deferred tax liabilities, the most notable adjustment to shareholder value was $81 million in underfunded pensions. This adjustment represents 8% of Allison’s market cap. See all adjustments to Allison’s valuation here.
Attractive Funds That Hold ALSN
The following funds receive our Attractive-or-better rating and allocate significantly to Allison:
- Catalyst/Lyons Tactical Allocation Fund (CLTIX) – 3.7% allocation and Very Attractive rating
- Fuller & Thaler Behavioral Unconstrained Equity Fund (FTZFX) – 3.3% allocation and Attractive rating
- Alpha Architect U.S. Quantitative Value ETF (QVAL) – 2.7% allocation and Very Attractive rating
- Touchstone Mid Cap Fund (TMCJX) – 2.7% allocation and Attractive rating
- Reinhart Mid Cap PMV Fund (RPMVX) – 2.5% and Attractive rating
This article originally published on June 15, 2020.
Disclosure: David Trainer, Kyle Guske II, and Matt Shuler receive no compensation to write about any specific stock, style, or theme.
Follow us on Twitter, Facebook, LinkedIn, and StockTwits for real-time alerts on all our research.
[1] Our core earnings are a superior measure of profits, as demonstrated in Core Earnings: New Data & Evidence a paper by professors at Harvard Business School (HBS) & MIT Sloan. The paper empirically shows that our data is superior to “Income Before Special Items” from Compustat, owned by S&P Global (SPGI).

1 Response to "This Firm Is Geared Up for a Recovery"
Thank you for this evaluation!