
We published an update on this Danger Zone pick on May 20, 2024. A copy of the associated report is here.
At the midpoint of its expected June 9 IPO price range, Marqeta (MQ: $22/share midpoint of IPO price range) is valued at roughly $12 billion and earns our Unattractive rating.
We think the stock is worth no more than $9 per share. Marqeta’s expected valuation of $12 billion implies that the company’s total processing volume (TPV), a key industry metric, will be 114% of PayPal’s (PYPL), a highly unlikely outcome given PayPal’s vast infrastructure and strong brand recognition.
Marqeta competitors, such as PayPal, have greater scale and distribution networks and generate enough cash flow to support investing in new technologies. Marqeta has been unable to turn a profit.
Marqeta depends too heavily on just one customer, Square (SQ), for its revenue. In 2020, 70% of Marqeta’s revenue came from Square, which is up from 60% in 2019. If that relationship were to sour, Marqeta’s stock could suffer greatly.
Despite the expensive price tag for Marqeta’s IPO, new investors will have almost no say over corporate governance. Insiders will hold 99% of the voting rights after the IPO.
The firm’s non-GAAP EBITDA understates its losses, and we’re not sure we can trust the rest of the financials given the material weakness in internal controls over financial reporting disclosed in Marqeta’s S-1.
We see no reason for investors to buy this IPO at its expected valuation of $12 billion. We believe a share price under $9 offers a more reasonable risk/reward dynamic for investors.
Our IPO research aims to provide investors with more reliable fundamental research.
Revenue Growth, Shrinking Losses, But Still No Profits
Marqeta loses money, though its losses are improving. Net revenue grew 103% year-over-year (YoY) in 2020 and Core Earnings[1] improved from -$123 million to -$47 million over the same time. The company’s return on invested capital (ROIC) also remains negative, while rising from -34% in 2019 to -19% in 2020.
Small Share of a Large Market
Marqeta provides the backend tools to enable its customers to create, distribute, and manage physical, virtual, and tokenized payment cards. Its customers include some of the most well-known “tech disruptors” in the world, such as Square (SQ), DoorDash (DASH), Instacart, Affirm (AFRM), and Uber (UBER).
In 2020 (the most recent data provided by the firm’s S-1), Marqeta’s platform processed $60.1 billion in TPV, which is up from $21.7 billion TPV in 2019. According to the firm’s S-1, its 2020 TPV equates to less than 1% of the $6.7 trillion worth of transaction volume conducted through U.S. card issuers in 2020. In other words, Marqeta has significant room to grow its market share as it grows customers and expands offerings.
Investors may further be enticed by this IPO given the expected growth in digital payments. As noted in the S-1,
- Visa (V) estimates that from 2016-2022, the share of global retail commerce conducted online will more than double from 9% to 19%
- Euromonitor projects electronic payments will represent 46% of the total global transaction volume by 2025, which is up from 31% in 2017
- McKinsey estimates alternative payment methods will make up 60% of global digital commerce by 2023.
Significant Incumbent Opposition
Marqeta faces competition from some of the largest payment processors in the world, including:
- Global Payments (GPN)
- Fiserv (FISV)
- Fidelity National Information Services (FIS)
- Wex (WEX)
- PayPal
- Ayden
- Stripe
Scale Disadvantages
Most of these incumbents have a major distribution advantage over Marqeta based on relationships across the globe with large card issuers such as banks and credit unions. While exact market share isn’t available for all competitors, we can compare different aspects of Marqeta’s business to its competition to get a sense of its scale disadvantages. For instance:
- Fidelity National Information Services processes $9 trillion in global payments, compared to $60 billion for Marqeta
- Global Payments has issued 680 million cards and is available in 100 countries, compared to 320 million and 36 countries for Marqeta
- Zelle, owned by seven large banks including Bank of America (BAC), JPMorgan Chase (JPM) and Wells Fargo (WFC) processed $307 billion in payments in 2020 and competes with Square’s Cash App (Marqeta’s largest customer)
Furthermore, the incumbents already offer many of the same features as Marqeta. For example, Fiserv, Fidelity National, and Global Payments enable customers to issue virtual credit cards, a key feature of Marqeta’s platform.
Given the scale advantages of its competition, we think growing market share will be very difficult for Marqeta, especially since its offerings are not meaningfully differentiated.
Profit Disadvantages
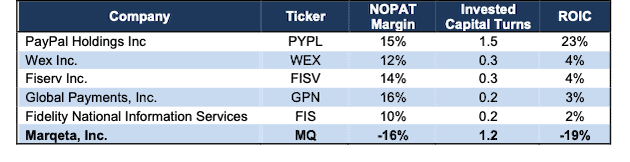
Figure 1 shows that Marqeta’s profitability, net operating profit after-tax (NOPAT) margin and ROIC, already ranks last amongst its publicly-traded competitors. While the company’s balance sheet efficiency (invested capital turns) is superior to all competition except PayPal, it is not enough to offset low operational efficiency.
Figure 1: Marqeta’s Profitability Vs. Competition: TTM
Sources: New Constructs, LLC and company filings
Catch-22: Lower Take Rate or Market Share?
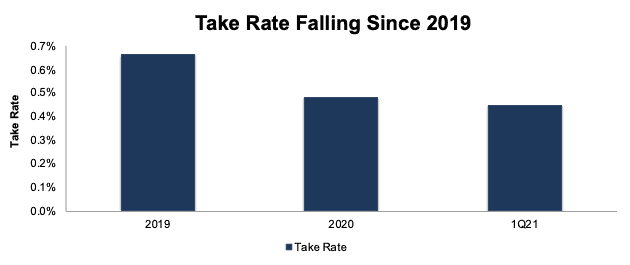
Marqeta collects a percent of its TPV as revenue and then pays out a portion of that revenue to issuing banks and card networks such as Visa and Mastercard (MA). In other words, Marqeta’s revenue is largely dependent upon the firm’s take rate, or the percentage of TPV it collects as revenue.
Unfortunately for potential IPO investors, Marqeta’s take rate is trending down. Since 2019, the firm’s take rate[2] declined from 0.66% to 0.45% in 1Q21, per Figure 2.
Given the ample competition noted above, take rate could decline further if Marqeta provides greater incentives (in the form of lower fees) in an effort to attract more customers to its platform. Doing so would boost TPV (and make market share look larger), but the firm would generate less revenue per dollar spent on its platform, thereby limiting its profitability prospects.
Figure 2: Marqeta’s Take Rate: 2019 to 1Q21
Sources: New Constructs, LLC and company filings
Customer and Issuing Bank Concentration Adds Risk
Despite impressive top-line growth and soaring TPV, the success of Marqeta has been largely tied to one customer – Square. In 2020, 70% of Marqeta’s revenue came from Square, which is up from 60% in 2019. As one of the leading small-business and cash payment apps, Square is certainly a great partner to have.
However, such high customer concentration adds material risk to investing in Marqeta’s IPO. Should Square decide to stop using Marqeta’s platform, or even use the platform less, Marqeta’s operations would be materially impacted.
Furthermore, in 2020, 96% of Marqeta’s TPV was settled through Sutton Bank. If Sutton Bank terminates its agreement with Marqeta, or cannot process additional transactions, Marqeta would incur additional costs to transfer transactions to other banks, which would also materially impact its profitability.
Potential Acquirers Passed on Marqeta When It was 60% Cheaper
Considering the M&A activity in the payments industry (Visa acquired Plaid, PayPal acquired Venmo, Fidelity National acquired Worldpay, Global Payments acquired Total System Services, and more) investors may be thinking Marqeta presents a good buyout target. However, potential acquirers clearly had their chance to buy Marqeta and passed, either because the firm was too expensive or has poor/unneeded technology.
With the IPO valuation at ~$12 billion or almost 3x the $4.3 billion valuation used for its May 2020 capital raise, we think potential acquirers are less likely to buy now (higher price) than last year (far lower price).
Additionally, the large incumbent competitors are the most likely potential acquirers, and they are much more likely to leverage their existing payment networks and scale to build rather than pay a high price for a firm with less than 1% of the total payment market and an undifferentiated offering.
Priced to be Bigger than PayPal
When we use our reverse discounted cash flow (DCF) model to analyze the future cash flow expectations baked into MQ, we find that shares are priced for growth in revenue that significantly outpaces the projected growth of its target market. Risk/reward at the IPO price is unattractive.
In order to justify the midpoint of its IPO price range ($22/share), Marqeta must:
- achieve a 13% NOPAT margin (the average of competition in Figure 2 compared to -16% for Marqeta in 2020) and
- grow revenue by 42% compounded annually for the next eight years, which is more than double the projected growth rate of the digital payment market through 2028
In this scenario, Marqeta would generate nearly $4.8 billion in revenue, which is over 16x Marqeta’s 2020 revenue and 64% of Global Payments’ TTM revenue.
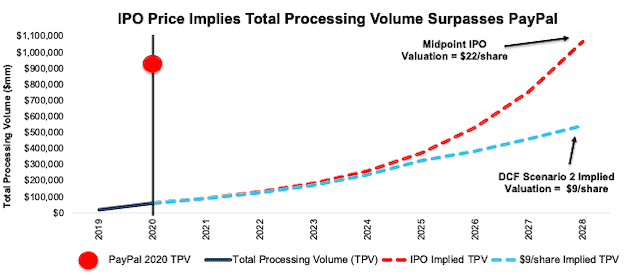
At its 1Q21 take rate, this scenario equates to nearly $1.1 trillion in total processing volume in 2028, which is nearly 18x Marqeta’s 2020 TPV and 114% of PayPal’s 2020 TPV.
DCF Scenario 2: Growth Is More In-Line with Industry Expectations
We review an additional DCF scenario to highlight the downside risk should Marqeta’s revenue growth fall more in-line with industry expectations.
If we assume Marqeta:
- achieves a NOPAT margin of 13% and
- grows revenue by 38% compounded annually from 2021-2025 (double projected industry growth rates) and
- grows revenue 19% compounded annually from 2026-2028 (equal to projected industry growth rates), then
MQ is worth just $9/share today – a 59% downside to the midpoint of the IPO price range. See the math behind this reverse DCF scenario.
Figure 3 compares the firm’s implied future TPV in these two scenarios to its historical TPV, along with the TPV of PayPal.
Figure 3: Midpoint IPO Valuation Is Too High
Sources: New Constructs, LLC and company filings
Each of the above scenarios also assumes Marqeta is able to grow revenue, NOPAT, and FCF without increasing working capital or fixed assets. This assumption is highly unlikely but allows us to create best-case scenarios that demonstrate the expectations embedded in the current valuation. For reference, Marqeta’s invested capital increased $158 million (54% of revenue) YoY in 2020.
Red Flags Investors Need to Know About
With a lofty valuation that implies significant improvement in both revenue and profits, investors should be aware that Marqeta’s S-1 also includes these other red flags.
Public Shareholders Have No Rights: A risk of investing in Marqeta’s IPO, and other recent IPOs, is the fact that the shares sold provide little to no say over corporate governance.
Marqeta is going public with two separate share classes, each with different voting rights. Investors in the IPO will get Class A Shares, with just one vote per share, while directors and early investors hold Class B Shares, with 10 votes per share.
Given the higher voting rights of Class B shares, early investors and executives will hold 99% of the voting rights after the IPO.
In other words, this IPO gives investors almost no voting power or control of corporate governance.
Non-GAAP EBITDA Understates Losses: Long a favorite of unprofitable companies, Marqeta’s chosen non-GAAP metric, adjusted EBITDA, shows a much rosier picture of the firm’s operations than GAAP net income or our Core Earnings. Adjusted EBITDA gives management significant leeway in how it presents results.
Marqeta’s adjusted EBITDA in 2020 removes $32 million (11% of revenue) in expenses including $28 million in share-based compensation expense. After removing all items, Marqeta reports adjusted EBITDA of -$15 million in 2020. Meanwhile, economic earnings, the true cash flows of the business, are much lower at -$59 million.
While Marqeta’s adjusted EBITDA follows the same trend in economic earnings over the past two years, investors need to be aware that there is always a risk that adjusted EBITDA could be used to manipulate earnings going forward.
We Don’t Know If We Can Trust the Financials: Investors should take Marqeta’s GAAP and non-GAAP numbers with a grain of salt because the firm’s management identified a material weakness in internal controls over financial reporting in 2019. The SEC does not require Marqeta to have an independent auditor provide an opinion on internal controls until its second annual filing following its IPO, so we’re glad the firm chose to disclose this information. However, the firm has given no assurances that the material weakness has been fixed, or when it will be fixed. From the S-1:
“While we are undertaking efforts to remediate this material weakness, we cannot predict the success of such efforts or the outcome of our assessment of the remediation efforts at this time. We can give no assurance that our efforts will remediate this deficiency in internal control over financial reporting…”
In other words, the risk the firm’s financials are misleading is still material and investors should be aware.
Critical Details Found in Financial Filings by Our Robo-Analyst Technology
Fact: we provide superior fundamental data and earnings models – unrivaled in the world.
Proof: Core Earnings: New Data and Evidence, forthcoming in The Journal of Financial Economics.
Below are specifics on the adjustments we make based on Robo-Analyst findings in Marqeta’s S-1:
Income Statement: we made $1 million of adjustments, with a net effect of removing $1 million in non-operating expenses (<1% of revenue). You can see all the adjustments made to Marqeta’s income statement here.
Balance Sheet: we made $81 million of adjustments to calculate invested capital with a net decrease of $77 million. The most notable adjustment was $1 million in operating leases. This adjustment represented 1% of reported net assets. You can see all the adjustments made to Marqeta’s balance sheet here.
Valuation: we made $939 million of adjustments with a net effect of decreasing shareholder value by $939 million. There were no adjustments that increased shareholder value. The largest adjustment to shareholder value was $553 million in preferred stock. This adjustment represents 5% of the midpoint of the IPO price range’s valuation. See all adjustments to Marqeta’s valuation here.
This article originally published on June 7, 2021.
Disclosure: David Trainer, Kyle Guske II, and Matt Shuler receive no compensation to write about any specific stock, style, or theme.
Follow us on Twitter, Facebook, LinkedIn, and StockTwits for real-time alerts on all our research.
[1] Only Core Earnings enable investors to overcome the errors, omissions and biases in legacy fundamental research, as proven in Core Earnings: New Data & Evidence, forthcoming in The Journal of Financial Economics.
[2] Marqeta’s take rate equals Net Revenue / TPV.