Recap from September Picks
Our Most Attractive Stocks (-0.8%) outperformed the S&P 500 (-0.9%) last month. Most Attractive Large Cap stock InterDigital (IDCC) gained 8% and Most Attractive Small Cap stock First United Corp (FUNC) was up 20%. Overall, 20 out of the 40 Most Attractive stocks outperformed the S&P 500 in September.
Our Most Dangerous Stocks (-1.5%) outperformed the S&P 500 (-0.9%) last month. Most Dangerous Large Cap stock RLJ Lodging Trust (RLJ) fell by 8% and Most Dangerous Small Cap Stock Zoe’s Kitchen (ZOES) fell by 15%. Overall, 18 out of the 40 Most Dangerous stocks outperformed the S&P 500 in September.
The successes of the Most Attractive and Most Dangerous stocks highlight the value of our forensic accounting as featured in Barron’s. Being a true value investor is an increasingly difficult, if not impossible, task considering the amount of data contained in the ever-longer annual reports. By analyzing key details in these SEC filings, our research protects investors’ portfolios and allows our clients to execute value-investing strategies with more confidence and integrity.
15 new stocks make our Most Attractive list this month and 7 new stocks fall onto the Most Dangerous list this month. October’s Most Attractive and Most Dangerous stocks were made available to members on October 5, 2016.
Our Most Attractive stocks have high and rising returns on invested capital (ROIC) and low price to economic book value ratios. Most Dangerous stocks have misleading earnings and long growth appreciation periods implied by their market valuations.
Most Attractive Stocks Feature for October: Home BancShares (HOMB: $21/share)
Home BancShares (HOMB), commercial and retail banking firm, is one of the additions to our Most Attractive stocks for October.
Since 2006, Home BancShares has grown after-tax profit (NOPAT) by 29% compounded annually to $156 million in 2015 and $178 million over the last twelve months, per Figure 1. The company’s NOPAT margin has improved from 19% in 2006 to 37% TTM while its return on invested capital (ROIC) has improved from 6% in 2006 to a top-quintile 15% TTM.
Figure 1: NOPAT Growth Since 2006
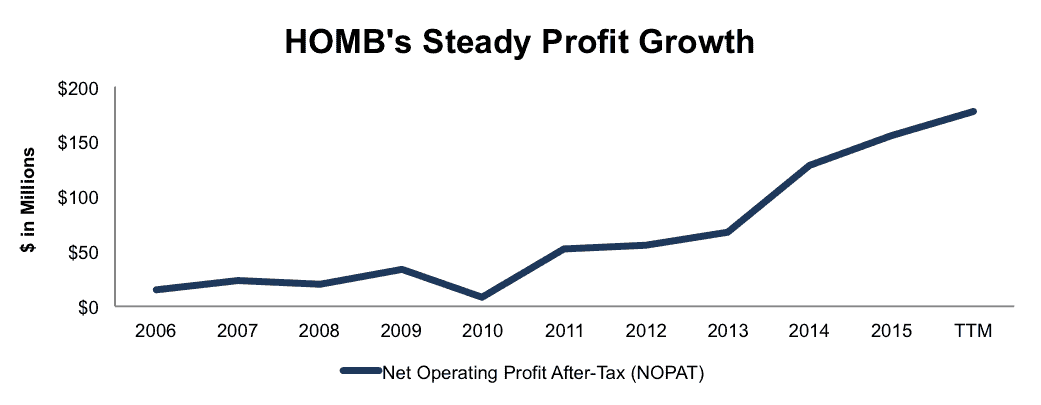
Sources: New Constructs, LLC and company filings
Impacts of Footnotes Adjustments and Forensic Accounting
In order to derive the true recurring cash flows, an accurate invested capital, and an accurate shareholder value, we made the following adjustments to Home BancShares’ 2015 10-K:
Income Statement: we made $21 million of adjustments, with a net effect of removing $17 million in non-operating expenses (4% of revenue). We removed $2 million in non-operating income and $19 million in non-operating expenses. You can see all the adjustments made to HOMB’s income statement here.
Balance Sheet: we made $305 million of adjustments to calculate invested capital with a net decrease of $103 million. One of the largest adjustments was $72 million due to deferred tax assets. This adjustment represented 6% of reported net assets. You can see all the adjustments made to HOMB’s balance sheet here.
Valuation: we made $32 million of adjustments with a net effect of decreasing shareholder value by $32 million. There were no adjustments that increased shareholder value. One of the notable adjustments was the removal of $27 million due to off-balance-sheet operating leases. This adjustment represents 2% of Home BancShares’ market cap. Despite the impact of these adjustments, HOMB remains undervalued.
Home BancShares Is Undervalued
HOMB is up only 1% over the past year, which has left shares significantly undervalued. At its current price of $21/share, HOMB has a price-to-economic book value (PEBV) ratio of 0.7. This ratio means the markets expects HOMB’s NOPAT to permanently decline by 30%. This pessimistic expectation seems to run counter to HOMB’s impressive profit growth since 2006.
If Home BancShares can maintain 2015 NOPAT margins of 36% (below 37% TTM) and grow NOPAT by just 8% compounded annually for the next decade, the stock is worth $31/share today – a 48% upside.
Most Dangerous Stocks Feature: Acxiom Corp (ACXM: $26/share)
Acxiom Corp (ACXM), data analytics software service provider, is one of the additions to our Most Dangerous stocks for October.
Over the past decade, Acxiom’s NOPAT has declined by 24% compounded annually, per Figure 2. The company’s ROIC has fallen from 7% in 2006 to a bottom quintile 1% TTM while its NOPAT margin has declined from 7% in 2006 to 1% TTM as well.
Figure 2: Acxiom’s Long-Term NOPAT Decline
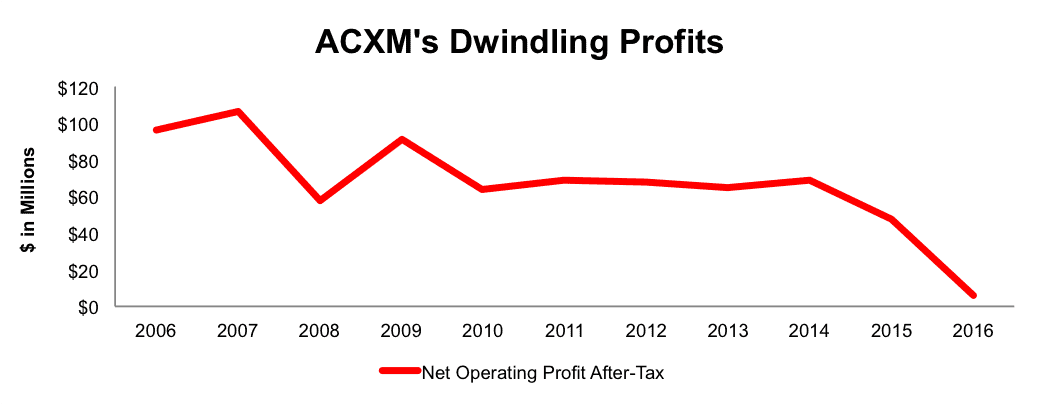
Sources: New Constructs, LLC and company filings
Forensic Accounting Reveals Overstated EPS
In order to derive the true recurring cash flows, an accurate invested capital, and an accurate shareholder value, we made the following adjustments to Acxiom’s 2016 10-K:
Income Statement: we made $61 million of adjustments, with a net effect of removing $1 million in non-operating income (<1% of revenue). We removed $31 million in non-operating income and $30 million in non-operating expenses. You can see all the adjustments made to ACXM’s income statement here.
Balance Sheet: we made $670 million of adjustments to calculate invested capital with a net increase of $312 million. One of the largest adjustments was $233 million due to asset write-downs. This adjustment represented 25% of reported net assets. You can see all the adjustments made to ACXM’s balance sheet here.
Valuation: we made $439 million of adjustments with a net effect of decreasing shareholder value by $225 million. One notable adjustment was $69 million in off-balance-sheet operating leases. This lease adjustment represents 3% of Acxiom’s market cap.
ACXM’s Alarming Valuation
Despite the clear deterioration in the fundamentals of the business, ACXM is up 58% over the past two years. This large increase in valuation coupled with a decline in the economics of the business makes ACXM significantly overvalued. To justify its current price of $26/share, ACXM must immediately achieve 5.6% NOPAT margins (its average level over the last 10 years, which is much higher than the current 1% TTM) and grow NOPAT by 35% compounded annually for the next 13 years. This scenario assumes ACXM can grow revenue by 15% each year, well above consensus expectations of 3% in 2016 and 7% in 2017. This expectation seems rather optimistic given that ACXM’s NOPAT has steadily declined over the last 10 years.
Even if ACXM can achieve a 5.6% NOPAT margin and grow NOPAT by 31% compounded annually for the next decade, the stock is worth only $8/share today – a 69% downside. This scenario assumes ACXM can grow revenue by consensus estimates in EY1 and EY2, and grow revenue each year thereafter at the same level as the EY2 estimates. The significant increase in margin (5.6% vs. 1% TTM) causes the large increase in NOPAT growth.
This article originally published here on October 11, 2016.
Disclosure: David Trainer, Kyle Guske II, and Kyle Martone receive no compensation to write about any specific stock, style, or theme.
Scottrade clients get a Free Gold Membership ($588/yr value). Login or open your Scottrade account & find us under Quotes & Research/Investor Tools.
Click here to download a PDF of this report.
Photo Credit: Lendingmemo.com (Flickr)