
What a week! With big stocks like Alphabet (GOOGL) and Apple (AAPL) reporting earnings, investors are sharpening their pencils. Of course, we think our Robo-Analyst technology gives us the sharpest pencil (that’s proven actually), and don’t think earnings are going to matter to these stocks at all. Sure, you might see a little volatility around the earnings releases. Haha – the prop traders need something to do. But, in the big picture, both of these stocks are fully-valued and present more downside risk and upside potential. Don’t get me wrong, Apple and Alphabet are fantastic businesses. It’s just that their stocks are priced for perfection – and then some.
One thing that Apple and Alphabet are not is…in our Exec Comp Aligned with ROIC Model Portfolio. Neither of them make the cut, but we are going to share some research on one stock that is in this month’s Exec Comp Aligned with ROIC Model Portfolio.
First, I want to share that our Exec Comp Aligned with ROIC Model Portfolio had a banner month. It (+5.5%) outperformed the S&P 500 (+4.0%) from September 13, 2024 through October 14, 2024. The best performing stock in the portfolio was up 15%. Overall, 10 of the 15 Exec Comp Aligned with ROIC Stocks outperformed the S&P from September 13, 2024 through October 14, 2024.
Now, back to the featured stock. It is from the Energy Sector, which ranked as the top sector in 4Q24 as we highlighted in our Sector Rankings for ETFs and Mutual Funds report.
Today’s feature provides a quick summary of how we pick stocks for this Model Portfolio. This summary is not a full Long Idea report, but it gives you insight into the rigor of our research and approach to picking stocks. Whether you’re a subscriber or not, we think it is important that you’re able to see our research on stocks on a regular basis. We’re proud to share our work.
The idea behind featuring stocks and sharing these features with you is to give you free insights into the uniquely high value-add of our research. We want you to know how we do research, so you know more about how reliable research looks and how real Ai and machine learning work.
We always talk about the importance of companies aligning executive compensation with ROIC, but it is just as important that companies calculate return on invested capital (ROIC) correctly. We recently published two articles showing how wrong the ROIC calculations from legacy firms like FactSet (FDS) and Morningstar (MORN) can be. You deserve research you can trust, and we’re the only research firm delivering proven-superior fundamental research and ROIC.
What’s the point of aligning compensation with ROIC if the executives are manipulating ROIC to look better than it truly is?
This Model Portfolio discerns between companies that calculate ROIC with rigor and those that do not. We measure how close the companies’ versions of ROIC (even if they call it by another name) are to our ROIC. The goal is to showcase companies that have quality ROIC calculations and prioritize value creation for investors by rewarding their executives for improving ROIC. In our opinion, there’s not a better group of stocks out there as I explain in this special training.
We’re not giving you the name of the stock featured, because it is only available to our Pro and Institutional members. But, there’s still so much here to share. We want you to see how much work we do and to know where to set the bar when evaluating research providers.
We hope you enjoy this research. Feel free to share with friends and colleagues.
We update this Model Portfolio monthly and October’s Exec Comp Aligned with ROIC Model Portfolio was updated and published for clients on October 16, 2024.
This Model Portfolio includes stocks that earn an Attractive or Very Attractive rating and align executive compensation with improving ROIC. This combination provides a unique list of long ideas as the primary driver of shareholder value creation is return on invested capital (ROIC).
Stock Feature for October: Energy Company
This company has grown revenue and net operating profit after tax (NOPAT) by 18% and 34% compounded annually, respectively, since 2019. The company’s NOPAT margin improved from 5% in 2019 to 9% in the trailing-twelve-months (TTM). Invested capital turns fell from 1.9 to 1.8 over the same time but rising NOPAT margins are enough to offset falling invested capital turns and drive the company’s return on invested capital (ROIC) from 9% in 2019 to 15% in the TTM.
Figure 1: Revenue & NOPAT: 2019 – TTM
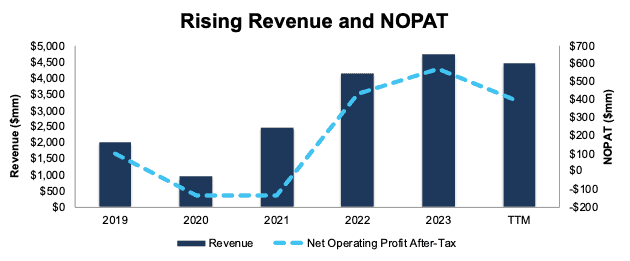
Sources: New Constructs, LLC and company filings
Executive Compensation Properly Aligns Incentives
This company’s compensation plan aligns the interests of executives and shareholders by tying a portion of its performance-based annual incentive payments to “Return on Capital Employed”.
The company’s inclusion of ROCE, a variation of ROIC, as a performance goal has helped create shareholder value by driving higher ROIC and economic earnings. When we calculate ROIC using our superior fundamental data, we find that the company’s ROIC has increased from 9% in 2019 to 15% in the TTM. Economic earnings rose from $32 million to $180 million over the same time.
Figure 2: ROIC & Economic Earnings: 2013 – TTM
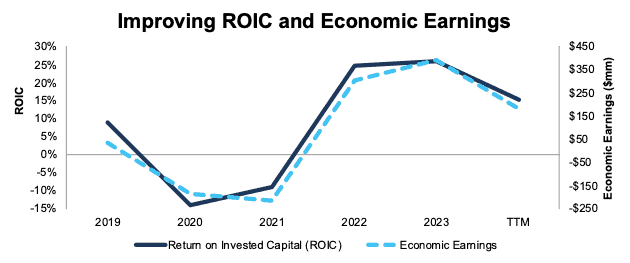
Sources: New Constructs, LLC and company filings
This Stock Has Further Upside
At its current price of $18/share, this stock has a price-to-economic book value (PEBV) ratio of 0.7. This ratio means the market expects this company’s NOPAT to permanently fall 30% from current levels. This expectation seems overly pessimistic for a company that has grown NOPAT 34% compounded annually since 2019 and 14% since 2017 (earliest data available).
Even if the company’s
- NOPAT margin falls to 6% (below TTM NOPAT margin of 10%) and
- revenue grows 3% (below the 19% CAGR in the last five years) compounded annually through 2033 then,
the stock would be worth $24/share today – a 33% upside. In this scenario, the company’s NOPAT would fall 4% compounded annually from 2023 through 2033.
Should the company grow NOPAT more in line with historical growth rates, the stock has even more upside.
Critical Details Found in Financial Filings by Our Robo-Analyst Technology
Below are specifics on the adjustments we made based on Robo-Analyst findings in this featured stock’s 10-Ks and 10-Qs:
Income Statement: we made around $50 million in adjustments with a net effect of removing just under $20 million in non-operating expenses. Professional members can see all adjustments made to income statements on the GAAP Reconciliation tab on the Ratings page on our website.
Balance Sheet: we made over $320 million in adjustments to calculate invested capital with a net decrease of over $180 million. One of the most notable adjustments was several millions in operating leases. Professional members can see all adjustments made to balance sheets on the GAAP Reconciliation tab on the Ratings page on our website.
Valuation: we made around $600 million in adjustments in adjustments, all of which decreased shareholder value. Apart from total debt, the most notable adjustment to shareholder value was deferred tax liability. Professional members can see all adjustments to valuations on the GAAP Reconciliation tab on the Ratings page on our website.
…there’s much more in the full report. You can start your membership here or login above to get access to this report and much more.