We closed the TDC pick on September 24, 2024. A copy of the associated Position Close report is here.
Check out this week’s Danger Zone interview with Chuck Jaffe of Money Life.
Last week, we looked at three of our worst Danger Zone picks from 2020. This week, we’re looking at the blowups we successfully predicted during 2020. Casper Sleep (CSPR: $7/share), Teradata Corporation (TDC: $25/share), and DoorDash (DASH: $207/share) are the Danger Zone highlights from 2020. We remain bearish on two of these stocks and are closing one.
In 2020, our Danger Zone picks overall failed to outperform as shorts, as the market soared to record heights. Only 11 out of our 34 Danger Zone picks outperformed the market (S&P 500) as shorts.
Overall, the Danger Zone stocks, including reiterated and closed ideas, averaged a 57% return in 2020 versus the S&P 500’s average return of 18% from each report’s published date.[1]
Our Danger Zone reports combine our proprietary fundamental data, proven superior in The Journal of Financial Economics[2], with qualitative research to highlight firms whose stocks present among the worst risk/reward. Danger Zone reports show investors how to use our research and the transparency of our analytical process.
Figure 1: Performance From Each Danger Zone Publish Date Through 12/31/2020

Sources: New Constructs, LLC
Highlight 1: Caper Sleep (CSPR) – Performance Since Report Published February 3, 2020 through 12/31/20[3]: Down 58% vs. S&P up 12%: Closing Position as of 1/19/21
We first put Casper Sleep in the Danger Zone in February 2020 prior to its IPO just a few days later. At the time, we noted the firm’s slowing and profitless revenue growth, weak competitive position, exorbitant expenses, and overvalued stock price. Despite outperforming as a short since its IPO, the stock remains overvalued and still holds significant downside risk.
What Went Right (for a Short Position): Casper has been unable to drive meaningful improvement in profitability, despite mattress and pillow sales soaring as consumers spend more time at home. The firm was hampered by supply chain issues and retail stores with little to no traffic due to closures. These challenges resulted in the firm missing earnings estimates in two of the past three quarters and revenue estimates in the most recent quarter.
We expect Casper to continue to struggle to meet revenue and earnings estimates in the face of significant competition from mattress providers such as Sleep Number (SNBR), Tempur Sealy International (TPX, Serta Simmons, Leesa, Tuft & Needle, Purple (PRPL) and home goods providers such as Walmart (WMT), Amazon (AMZN), Bed Bath & Beyond (BBBY), Wayfair (W), Overstock.com (OSTK), and many more.
Why We’re Closing CSPR: While the firm’s fundamentals remain poor, with a return on invested capital (ROIC) of -51% and net operating profit after-tax (NOPAT) margin of -19%, the risk/reward is no longer as dangerous given the precipitous decline in the stock.
The lower valuation implies the firm will achieve NOPAT margins (2%) that are half of Purple’s TTM margin and grow revenue by 17% compounded annually for the next eight years. See the math behind this reverse DCF scenario.
While no walk in the park, this scenario is not outside the realm of possibility once COVID-19 is in the rear view mirror (as consensus estimates expect). Additionally, Casper could represent an inexpensive add-on acquisition to a larger home goods firm given its smaller market cap. As a result, we are taking gains and closing this short position.
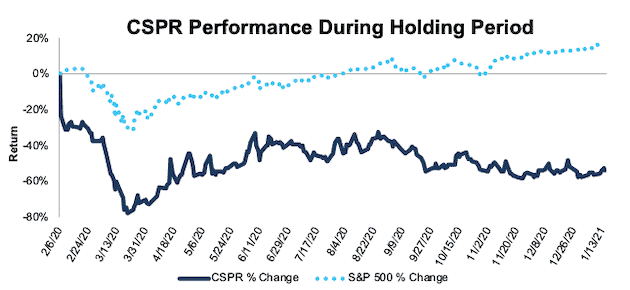
During the 350-day holding period, CSPR outperformed as a short position, falling 54% compared to a 15% gain for the S&P 500.
Figure 2: CSPR vs. S&P 500 – Price Return – Successful Short Call
Sources: New Constructs, LLC and company filings
Note: Gain/Decline performance analysis excludes transaction costs and dividends.
Highlight 2: Teradata (TDC) – Performance Since Report Published January 27, 2020 through 12/31/20: Down 12% vs. S&P up 16%
We first put Teradata in the Danger Zone in January 2020. We noted the firm’s struggles transitioning to a software-as-a-service (SaaS) business, overstated GAAP net income, low profitability compared to peers, and overvalued stock price.
What Went Right (for a Short Position): The struggles noted in our original report persist, including low profitability and rising costs. After crashing in March 2020, the stock nearly returned to its pre-pandemic highs in early April only to fall again through October 2020. At the end of October 2020 the stock was down 28% from the time we published our report but has since recovered and once again looks overvalued.
Why TDC Is Still in the Danger Zone: Teradata’s shift in business model is not working in a way that drives profit growth from a lower revenue base. Since 2016, Teradata’s NOPAT margin fell from 13% to <1% TTM while its ROIC fell from 22% to <1% over the same time. Meanwhile, the market-cap-weighted-average NOPAT margin (10%) and ROIC (33%) of publicly traded peers listed in TDC’s proxy statement have both improved significantly.
Furthermore, the purported benefits of the transition to a SaaS recurring revenue model remain elusive. Total expenses, which include cost of revenue, SG&A and R&D, have surged from 86% of revenue in 2016 to 100% TTM. If the firm cannot derive meaningful cost savings from its SaaS transition nearly five years in, investors must ask, will it ever?
Valuation Implies Teradata Doubles Market Share: Despite worsening profitability and declining revenue, Teradata’s stock price has increased over 35% since its late October 2020 lows.
Now, the expectations baked into its stock price of ~$25/share are overly optimistic. To justify its current valuation Teradata must:
- Immediately achieve a 6% NOPAT margin (5-year average, compared to 0.1% TTM)
- Grow revenue by 7% compounded annually for the next eight years.
See the math behind this reverse DCF scenario. In this scenario, Teradata’s revenue in 2027 would reach $3.3 billion, or 6% of its estimated total addressable market (TAM)[4]. Over the TTM, Teradata has an estimated 3% share of its TAM. While not as outlandish as DoorDash below, this expectation seems even more difficult given increased competition in the data analytics market and Teradata’s struggles to this point. Also of note, Teradata is not a new startup scraping by to gain market share. Instead, it’s the incumbent (founded in 1979) fighting off the new startups with minimal success, yet its stock price implies just the opposite.
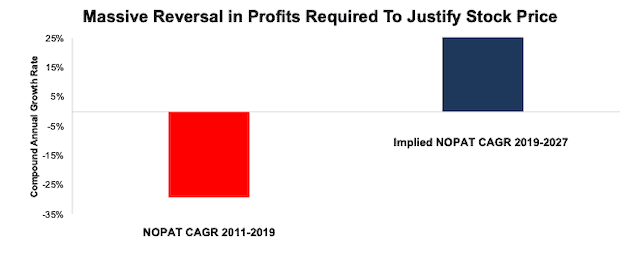
This scenario also implies Teradata’s NOPAT would grow 31% compounded annually over the next eight years. Such a scenario seems overly optimistic given that Teradata’s NOPAT has fallen from $82 million in 2017 to just $3 million TTM. Furthermore, average consensus estimates expect Teradata’s revenue to grow less than 1% compounded annually for the next three years, or well below the revenue growth implied by the current stock price.
Figure 3 compares the firm’s NOPAT compound annual growth rate (CAGR) over the past eight years to the implied NOPAT CAGR over the next eight years in this scenario.
Figure 3: Current Valuation Implies More Than Double Industry Growth Rates
Sources: New Constructs, LLC and company filings
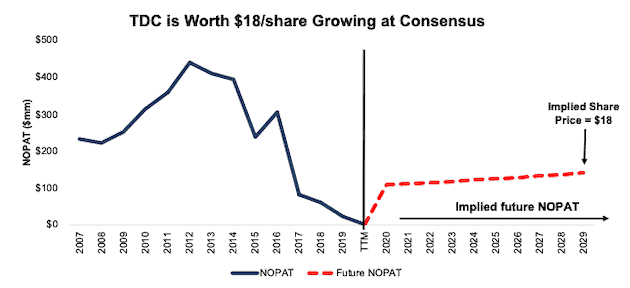
28% Downside Assuming Consensus Growth: Even if we assume Teradata can achieve a 6% NOPAT margin (five-year average and highest since 2016) and grow NOPAT by 20% compounded annually (which assumes revenue growth continues at 2022 consensus of 3% each year thereafter) for the next decade, the stock is worth only $18/share today – a 28% downside to the current stock price. See the math behind this reverse DCF scenario.
Figure 4 compares the firm’s implied future NOPAT in this scenario to its historical NOPAT.
Figure 4: TDC Has Large Downside Risk: DCF Valuation Scenario
Sources: New Constructs, LLC and company filings.
Each of the above scenarios also assumes Teradata is able to grow revenue, NOPAT, and FCF without increasing working capital or fixed assets. This assumption is highly unlikely but allows us to create best-case scenarios that demonstrate how high expectations embedded in the current valuation are.
Highlight 3: DoorDash (DASH) – Performance Since Report Published November 23, 2020 through 12/31/20[5]: Down 22% vs. S&P up 1%
We called DoorDash “The Most Ridiculous IPO of 2020” when we first put in the Danger Zone in November 2020. We updated our analysis when DoorDash increased its IPO price range here and here. We felt, and continue to believe, that the IPO bailed out private investors by dumping shares on the unsuspecting public.
What Went Right (for a Short Position): DoorDash stormed out of the IPO gates by pricing above its IPO range and opening nearly 80% above the IPO price. DoorDash was overvalued at its IPO price and was even more so after the IPO pop. From the opening price through the end of 2020, DoorDash fell 22% while the S&P rose 1%. However, shares have since risen 39% in 2021.
Such rollercoaster price action could continue as noise traders and speculators move in and out of DoorDash. However, for long-term investors, DoorDash holds significant downside risk, as we’ll show below.
Why DASH Is Still in the Danger Zone: While the resurgence of COVID-19 may drive demand for a bit longer, DoorDash continues to have:
- no moat
- no profits in the best-possible environment
- competition that can offer the same service for free.
As noted in our original report, the only firms with worse TTM NOPAT margin than DoorDash are Uber and Lyft. If DoorDash can’t do better in this environment, perhaps the best-possible environment for food delivery, then when will it ever be consistently profitable?
Valuation Implies DoorDash Owns 141% of TAM: When we use our reverse DCF to analyze the expectations implied by DoorDash’s stock price, we see just how overvalued shares are. DoorDash’s stock price implies huge improvement in both market share and profit margins, two metrics that rarely improve simultaneously in competitive markets.
To justify its current price of ~$207/share, DoorDash must:
- Immediately improve its NOPAT margin to 8% compared to -67% in 2019 and an estimated -12% over the trailing-twelve months
- 8% NOPAT margin is equal to United Parcel Service’s (UPS) 2019 and TTM NOPAT margin
- Grow revenue by 47% compounded annually for the next 11 years.
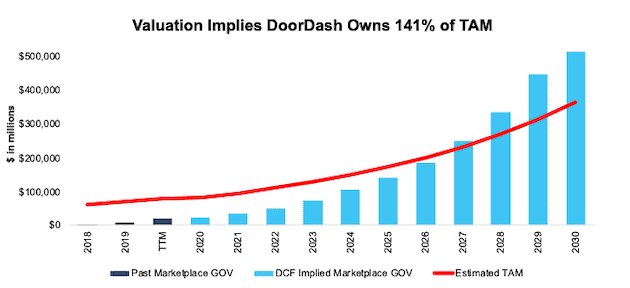
See the math behind this reverse DCF scenario. In this scenario, DoorDash would earn nearly $60 billion in revenue in 2030. At its TTM take rate, this scenario equates to ~$514 billion in marketplace gross order volume for DoorDash in 2030. Take rate measures the percentage of marketplace gross order volume (GOV) DoorDash captures as revenue.
For reference, UBS estimates the global food delivery market will be worth $365 billion in 2030, and the average NOPAT margin of DoorDash’s peers (listed in original report) is -5%.
In other words, to justify DoorDash’s current price of ~$200/share, the firm must capture over 141% of the projected 2030 global food delivery spend, compared to ~16% TTM. See Figure 5.
Importantly and even more challenging, DoorDash must capture greater than 100% of the market while also improving margins from -12% to 8%, well above peers’ average.
To illustrate the difficulty in maintaining market share and high margins in an industry competing on price, look no further than GrubHub. In 2017, GrubHub held ~55% of the U.S. food delivery app market (excludes restaurants that deliver their own food) and earned a NOPAT margin of 10%. As competition flooded the market, GrubHub’s market share fell to 18% in October 2020, and its TTM NOPAT margin is -5%.
Given the high level of competition in the food delivery app market, we think it is highly unlikely, if not impossible, for DoorDash to achieve anything close to the market share growth and NOPAT margin improvements baked into its share price.
Figure 5: Implied Marketplace GOV Grows From 5% to 141% of Food Delivery Market
Sources: New Constructs, LLC, company filings, and UBS
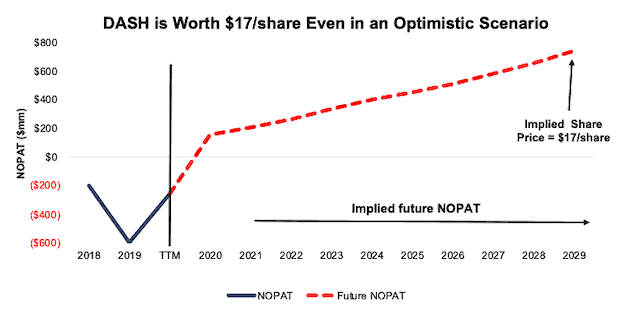
Worth No More Than $17/share: Even if we assume that consumers increasingly choose food delivery as a means to eat restaurant food after COVID-19, and DoorDash’s revenue growth remains elevated for years to come, the stock holds significant downside.
If we assume DoorDash can achieve a 6% NOPAT margin (average of United Parcel Service and FedEx’s TTM NOPAT margins) and grow revenue by 30% compounded annually for the next decade, the stock is worth just $17/share today – a 92% downside to the current price. See the math behind this reverse DCF scenario.
Figure 6 compares the firm’s implied future NOPAT in this scenario to its historical NOPAT.
Figure 6: DoorDash Has Large Downside Risk: DCF Valuation Scenario
Sources: New Constructs, LLC and company filings.
Each of the above scenarios also assumes DoorDash is able to grow revenue, NOPAT, and FCF without increasing working capital or fixed assets. This assumption is highly unlikely but allows us to create best-case scenarios that demonstrate how high expectations embedded in the current valuation are. For reference, DoorDash’s invested capital increased $813 million (92% of 2019 revenue) year-over-year in 2019.
This article originally published on January 19, 2021.
Disclosure: David Trainer, Kyle Guske II, and Matt Shuler receive no compensation to write about any specific stock, sector, style, or theme.
Follow us on Twitter, Facebook, LinkedIn, and StockTwits for real-time alerts on all our research.
[1] The S&P 500 gained 16% in 2020, but since our picks are published over the course of the year, we measure performance of our picks against the S&P 500 at the publication dates, not the beginning of the year.
[2] Our reports utilize our Core Earnings, a superior measure of profits, as demonstrated in Core Earnings: New Data & Evidence, a paper by professors at Harvard Business School (HBS) & MIT Sloan. Recently accepted by the Journal of Financial Economics, the paper proves that our data is superior to all the metrics offered elsewhere.
[3] Performance measured from Casper’s opening price of $14.50/share on February 6, 2020.
[4] Teradata provides both traditional data warehousing and business intelligence and analytics services. Prescient & Strategic Intelligence expects the global data warehouse as a service market to reach $10.9 billion by 2027. Coherent Market Insights expects the business intelligence and analytics market to reach $55.2 billion by 2027. We combine these two forecasts to arrive at the 2027 total addressable market (TAM) of $66.1 billion.
[5] Performance measured from DoorDash’s opening price of $182/share on December 9, 2020.
