
Check out this week’s Danger Zone interview with Chuck Jaffe of Money Life.
Amidst declining fundamentals across the sector, we’ve identified a tech stock that looks particularly risky. A combination of falling core earnings and economic earnings, low ROIC, and an overvalued stock price land Teradata Corporation (TDC: $27/share) in the Danger Zone.
Reported Results Mislead Investors
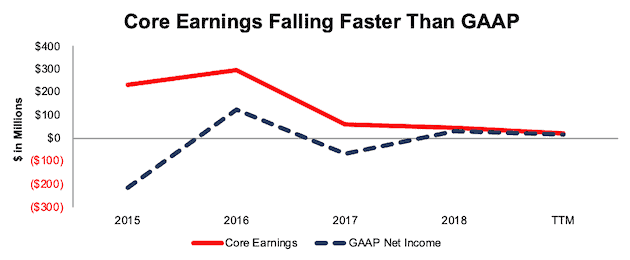
From 2015-TTM, TDC’s GAAP net income improved from -$214 million to $14 million. Meanwhile, core earnings[1], which exclude unusual gains and losses, fell from $233 million to $23 million over the same time, per Figure 1.
Figure 1: TDC’s GAAP Net Income Vs. Core Earnings
Sources: New Constructs, LLC and company filings.
In prior years, TDC’s GAAP net income actually understated its core earnings due to non-recurring expenses included in reported earnings, such as:
- $47 million in acquisition-related transaction, integration and reorganization expenses in 2016
- $24 million in professional services, legal and other associated costs related to the business transformation in 2017
This understatement in prior years creates the illusion of improved profits in the current period. Investors who don't have time to read financial footnotes are more likely to be misled by these non-recurring items. In reality, core earnings are in a long-term decline.
Non-GAAP Metrics Further Mislead Investors
TDC would rather investors focus on flawed non-GAAP metrics such as non-GAAP net income. On page 27 (Section 4.1) of a recent Harvard Business School and MIT Sloan paper, experts show that “Street Earnings are not only an incomplete reflection of firms’ non-operating earnings but also reflect managerial biases”. If you think non-GAAP metrics are any better, you’re mistaken.
The most common, and often largest item TDC removes to calculate non-GAAP net income is stock-based compensation expense. In 2018, TDC removed $66 million (42% of non-GAAP net income) in stock-based compensation.
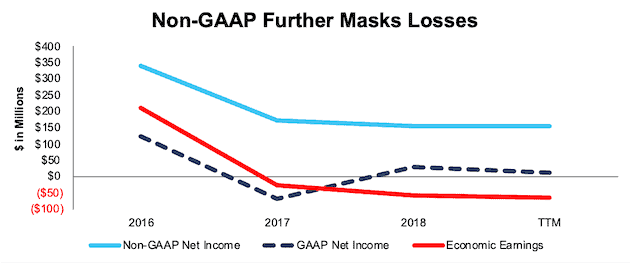
Per Figure 2 TDC’s TTM non-GAAP net income of $154 million is well above GAAP net income of $14 million. Economic earnings, which account for the non-recurring items noted earlier, as well as changes to the balance sheet, are even lower at -$64 million.
Figure 2: TDC’s Non-GAAP Net Income is Misleading
Sources: New Constructs, LLC and company filings.
TDC’s Profitability Lags in a Competitive Industry
TDC faces significant competition in the data analytics and visualization market and has yet to prove it can successfully transition to a software-as-a-service (SaaS) model in a way that creates shareholder value.
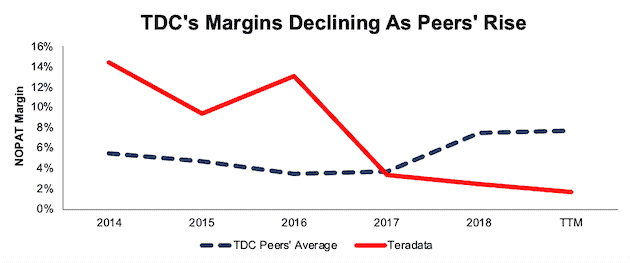
TDC’s net operating profit after-tax (NOPAT) margins have fallen from 14% in 2014 to 2% TTM. Over the same time, the cap-weighted average of the publicly traded peers listed in TDC’s proxy statement[2], has improved from 5% to 8%. See Figure 3.
Figure 3: TDC’s NOPAT Margin Vs. Peers
Sources: New Constructs, LLC and company filings.
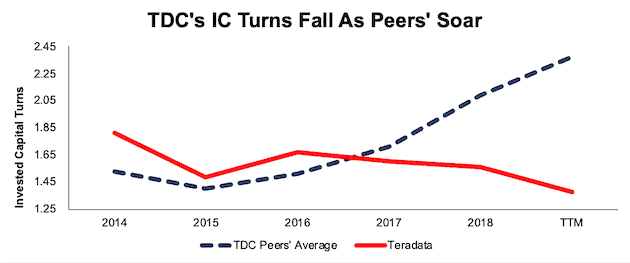
TDC’s capital efficiency is also declining. Since 2014, TDC’s invested capital turns, which represent the level of revenue generated per dollar of invested capital, have declined from 1.81 to 1.38. The market cap weighted average of the peers mentioned above improved from 1.52 to 2.37 over the same time.
Figure 4: TDC’s Invested Capital Turns Vs. Peers
Sources: New Constructs, LLC and company filings.
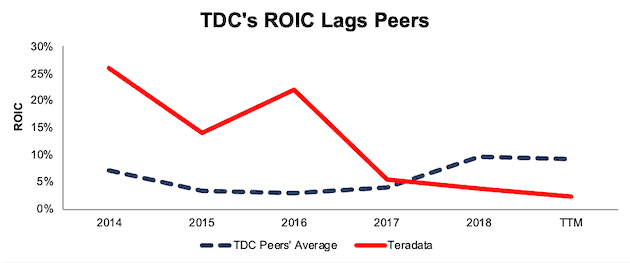
The combination of margin contraction and deteriorating capital efficiency drives TDC’s return on invested capital (ROIC) below its peers. Per Figure 5, TDC once earned a significantly higher ROIC than its peers. However, its ROIC has fallen from 26% in 2014 to just 2% TTM. Meanwhile, the market cap weighted peer average has improved from 7% to 9% over the same time.
Figure 5: TDC’s ROIC Vs. Peers
Sources: New Constructs, LLC and company filings.
Struggles Go Beyond Business Model Transition
Bulls will argue that Teradata’s fundamental weakness is simply the temporary result of the firm’s transition from a perpetual software license and hardware business model to a recurring revenue, software-as-a-service model. Unfortunately, these arguments ignore the deterioration in the business that occurred even before this transition.
Revenue Decline Began Before Transition: Teradata announced its business transformation in the fourth quarter of 2015. This transformation was supposed to reduce the company’s cost structure, focus on the core data and analytics business, and modify the company’s go-to-market approach.
However, as Figure 6 shows, the deterioration in profits began well before this transformation was announced. From 2012-2015, NOPAT declined 18% compounded annually, margins fell from 16% to 9%, and ROIC declined from 33% to 14%. To buy into the argument that the transformation alone is causing the weakness in recent years, one must ignore the deterioration in years prior.
Figure 6: TDC’s NOPAT Decline Before & After Business Transformation
Sources: New Constructs, LLC and company filings.
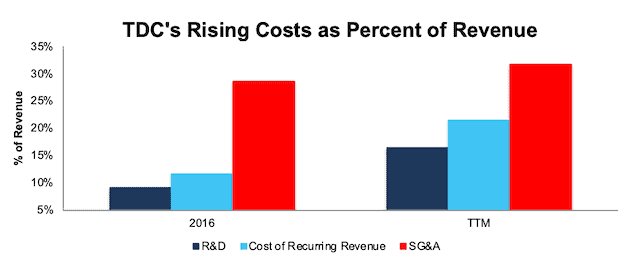
Not Achieving Any Cost Benefits During Transition: Teradata’s business transformation was supposed to reduce its cost structure, but it has to show any results. If the company is foregoing higher perpetual license and hardware revenue in an effort to build a steady stream of (lower) recurring revenue, it must lower costs (and increase margins) to make up the difference. However, Teradata’s costs, some of which are down in pure dollar value, have actually increased as a percent of revenue.
TDC’s selling, general, and administrative expenses rose from 29% of revenue in 2016 to 32% TTM. Its research & development expenses rose from 9% of revenue in 2016 to 16% TTM. The cost of recurring revenue increased from 12% of revenue in 2016 to 21% TTM. Overall, total operating expenses have grown from 41% of revenue in 2016 to 48% TTM.
TDC is not achieving the economies of scale to lower costs at an equal or faster pace than falling revenue.
Figure 7: TDC’s Costs Are Rising
Sources: New Constructs, LLC and company filings.
CEO Change Represents More of the Same: In May 2016, Teradata appointed Victor Lund as CEO to help “realize the benefits of the transformation, build on the company’s strengths, drive long-term growth, and increase shareholder value.” However, as the company’s fundamentals continued to deteriorate, TDC promoted Oliver Ratzesberger to CEO in January 2019 and Mr. Lund moved into the chairman of the board position.
In November 2019, TDC announced Mr. Ratzesberger resigned, with TTM results worse off than 2018. Mr. Lund resumed his former position as CEO.Multiple CEO changes in a four-year span don’t create confidence in the firm’s ability to execute, especially when the company is shuffling back and forth between the same people.
Great Product, Not Creating Value for Users: Despite the issues above, we’re not here to make the claim that Teradata fails to provide a good product for its customers. In Gartner’s report on Data Management Solutions for Analytics firms, Teradata ranked highest among competitors in four separate use cases.
However, simply providing a good product is half the battle in an industry where customers have multiple options. A firm must also provide its products at attractive prices, whereby customers believe they’re getting good value for the cost. In the same report linked above, Gartner noted that Teradata had “the lowest relative survey score in the impression of value for the money spent.”
Customers already believing they’re not getting good value for the money being spent makes it increasingly unlikely that TDC could raise prices in an effort to improve margins. However, TDC must improve margins to meet the expectations baked into the stock price, as we’ll show below.
TDC Is Significantly Overvalued
In 2019, the market saw some of TDC’s overvaluation as the stock fell 29% in 2019. However, even at its lower price, TDC still holds significant downside risk and remains very expensive. Below we’ll use our reverse DCF model to quantify the future cash flow expectations baked into the current stock price.
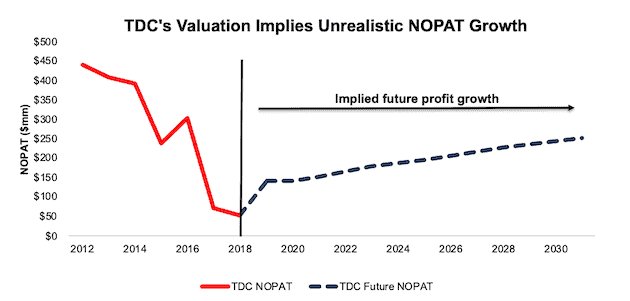
To justify its current price of $27/share, TDC must achieve 7% NOPAT margins (peer average in 2018, compared to 2% TTM) and grow NOPAT by 13% compounded annually for the next 13 years. See the math behind this reverse DCF scenario. This expectation seems overly optimistic given TDC’s margins have fallen in each of the last two years and its TTM NOPAT declined by nearly 60% over the prior TTM period. Figure 9 illustrates the implied NOPAT growth in this scenario compared to the firm’s NOPAT decline historically.
Figure 9: TDC’s Implied NOPAT Growth is Overly Optimistic
Sources: New Constructs, LLC and company filings.
Even if TDC can more than triple current margins to 6% (would be best since 2016) and grow NOPAT by 11% compounded annually for the next decade, the stock is worth just $17/share today – a 37% downside. See the math behind this reverse DCF scenario.
Each of these scenarios also assumes TDC is able to grow revenue, NOPAT and FCF without increasing working capital or fixed assets. This assumption is unlikely but allows us to create best-case scenarios that demonstrate how high expectations embedded in the current valuation are.
Acquisition Would be Unwise
Often the largest risk to any bear thesis is what we call “stupid money risk”, which means an acquirer comes in and pays for TDC at the current, or higher, share price despite the stock being overvalued. Many of the largest competitors in the industry, given their vast resources, could see an acquisition as a quick path to updating their product portfolio. However, given the low profitability, a product providing low value relative to its costs, and an overvalued stock price, we think it would be unwise for a larger firm to acquire TDC at current levels.
However, we think it helps to quantify what, if any, acquisition hopes are priced into the stock.
Walking Through the Acquisition Math
First, investors need to know that Teradata has large (hidden) liabilities that make it more expensive than the accounting numbers would initially suggest.
- $118 million in underfunded pensions (4% of market cap)
- $65 million in operating leases (2% of market cap)
- $11 million in outstanding employee stock options (<1% of market cap)
After adjusting for these liabilities, we can model multiple purchase price scenarios. For this analysis, we chose Oracle (ORCL) as a plausible acquirer of TDC, but analysts can use just about any company to do the same research. The key differences are the weighted average cost of capital (WACC) and ROIC for assessing different hurdle rates for a deal to create value.
Even in the most optimistic of scenarios, TDC is worth less than its current share price.
Figures 9 and 10 show what we think ORCL should pay for TDC to ensure it does not destroy shareholder value. There are limits on how much ORCL would pay for TDC to earn a proper return, given the NOPAT or free cash flows being acquired.
Each implied price is based on a ‘goal ROIC’ assuming different levels of revenue growth. In both scenarios, the estimated revenue growth rate is -13% in year one and +1% in year two, which are the consensus estimates for TDC’s revenue growth. For the subsequent years, we use 1% in scenario one because it represents a continuation of consensus estimates. We use 8% in scenario two because it assumes TDC could grow faster with the large support, resources, and customer base of Oracle.
We conservatively assume that ORCL can grow TDC’s revenue and NOPAT without spending any working capital or fixed assets beyond the original purchase price. We also assume TDC stops its margin decline and achieves an 8% NOPAT margin (TTM average of peer group above).
Figure 9: Implied Acquisition Prices for Value-Neutral Deal
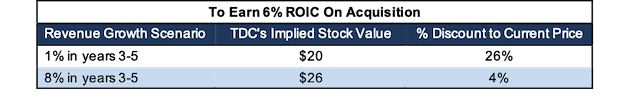
Sources: New Constructs, LLC and company filings
Figure 9 shows the ‘goal ROIC’ for ORCL as its WACC, or 6%. This scenario represents the minimum level of performance required to not destroy value. Even if TDC can grow revenue by consensus estimates in years 1-2 and 8% compounded annually in years 3-5, the firm is worth less than its current price of $27/share. It’s worth noting that any deal that only achieves a 6% ROIC would not be accretive, as the return on the deal would equal ORCL’s WACC.
Figure 10: Implied Acquisition Prices to Create Value
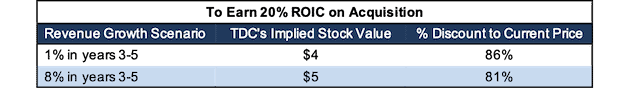
Sources: New Constructs, LLC and company filings
Figure 10 shows the next ‘goal ROIC’ of 20%, which is ORCL’s current ROIC. Acquisitions completed at these prices would be truly accretive to ORCL shareholders. Even in the best-case growth scenario, the implied stock value is significantly less than the current price. Any scenario assuming less revenue growth would result in further capital destruction.
Catalyst: Missed Earnings Could Sink Shares
TDC has missed earnings and/or revenue expectations in each of the last two quarters. In the most recent quarter (3Q19), the stock dropped over 18% in one day as earnings missed and guidance came in well below expectations. In 2Q19, when TDC’s earnings were in-line, and revenue below expectations, the stock dropped 8% in one day.
As costs continue to increase as a percent of sales, and sales continue their multi-year decline, similar price movement could occur if TDC misses earnings again or reports recurring revenue growth below expectations. The company’s transformation is many years in the making, with little to show for it. As patience runs thin, the odds of the stock dropping to more reasonable levels increase. Another miss on earnings could push investors to sell as they’re forced to face the reality of TDC’s deteriorating business.
What Noise Traders Miss With TDC
In general, markets aren’t good at identifying value destroying companies that waste shareholder capital. Instead, due to the proliferation of noise traders, markets are more likely to pump up popular momentum stocks, while undervaluing high-quality unconflicted & comprehensive fundamental research. Here’s a quick summary for what noise traders miss when analyzing TDC:
- Economic earnings are negative and declining despite improving GAAP results
- Operational and capital efficiency of TDC’s business severely lags peers
- Fundamentals began deteriorating before transition to SaaS and haven’t improved since
- Valuation still implies significant improvement in margins
Executive Compensation Adds Risk
TDC’s executives may not care about the deteriorating fundamentals because their compensation is tied to metrics that don’t measure them accurately. In 2018, annual bonuses were tied to target GAAP revenue and non-GAAP operating income goals. As with non-GAAP net income above, non-GAAP operating income excludes real costs of doing business, such as stock-based compensation expense, and acquisition, integration, and reorganization costs. Now, that we have proof from HBS & MIT Sloan that managers manipulate their numbers, we wonder why the TDC board of directors allows these kinds of metrics to determine executive pay.
In 2018, long-term equity awards, of which 70% are performance based, were tied to target annual recurring revenue growth levels and percent of subscription-based product booking goals. Each of these target goals focuses executives on top-line growth, while ignoring costs. In 2019, these performance based equity awards will be tied to annual recurring revenue growth levels and free cash flow as a percent of revenue.
As long as TDC continues to use these flawed metrics, its executives will be incentivized to boost their growth numbers with no attention to the underlying fundamentals of the business. Instead of incentivizing executives with non-GAAP and revenue goals, we’d recommend the firm’s compensation committee tie pay to ROIC, which is directly correlated with creating shareholder value.
Insider Activity Provides Little Insight and Short Interest is High
Over the past 12 months, 699 thousand insider shares have been purchased and 143 thousand have been sold for a net effect of 556 thousand insider shares purchased. These sales make up <1% of shares outstanding.
Short interest is currently 12.5 million shares, which equates to 11% of shares outstanding and just over nine days to cover. Short interest is up 4% from the prior month as the firm’s fundamentals deteriorate and the stock remains overvalued.
Critical Details Found in Financial Filings by Our Robo-Analyst Technology
As investors focus more on fundamental research, research automation technology is needed to analyze all the critical financial details in financial filings as shown in the Harvard Business School and MIT Sloan paper, "Core Earnings: New Data and Evidence”.
Below are specifics on the adjustments we make based on Robo-Analyst findings in Teradata’s 2018 10-K:
Income Statement: we made $89 million of adjustments with a net effect of removing $24 million in non-operating expense (1% of revenue). We removed $56 million related to non-operating expenses and $33 million related to non-operating income. You can see all the adjustments made to TDC’s income statement here.
Balance Sheet: we made $1.5 billion of adjustments to calculate invested capital with a net increase of $105 million. The most notable adjustment was $566 million (42% of reported net assets) in asset write-downs. You can see all the adjustments made to TDC’s balance sheet here.
Valuation: we made $1.2 billion of adjustments with a net effect of decreasing shareholder value by $358 million. The largest adjustment to shareholder value was $658 million in total debt, which includes $65 million in operating leases. This lease adjustment represents 2% of TDC’s market value. See all adjustments to TDC’s valuation here.
Unattractive Funds That Hold TDC
The following funds receive our Unattractive rating and allocate significantly to Teradata.
- Chartwell Mid Cap Value Fund (BERCX) – 3.1% allocation and Unattractive rating
- AMG Mangers Fairpointe Mid Cap Fund (ABMIX) – 2.6% allocation and Unattractive rating
- Columbia Select Large Cap Value Fund (SLVAX) – 2.4% allocation and Unattractive rating
- AMG Managers Fairpointe ESG Equity Fund (AFFEX) – 1.6% allocation and Unattractive rating
This article originally published on January 27, 2020.
Disclosure: David Trainer, Kyle Guske II, Sam McBride, and Matt Shuler receive no compensation to write about any specific stock, style, or theme.
Follow us on Twitter, Facebook, LinkedIn, and StockTwits for real-time alerts on all our research.
[1] In Core Earnings: New Data & Evidence, professors from Harvard Business School and MIT Sloan show that our “novel dataset” of footnotes disclosures produces a measure of core earnings that is “incremental to alternative measures of operating performance in predicting an array of future income measures.” The alternative measures used in the paper include the IBES “Street Earnings” owned by Refinitiv and Compustat’s[1] “Income Before Special Items. Blackstone (BX) and Thomson Reuters (TRI) own Refinitiv. S&P Global (SPGI) owns Compustat.
[2] Which consists of 22 similarly sized companies in the software industry, including Gartner (IT), CoreLogic (CLGX), Autodesk Inc. (ADSK), ServiceNow (NOW), and NetApp (NTAP).