
We closed this position on January 19, 2021. A copy of the associated Position Update report is here.
Check out this week’s Danger Zone interview with Chuck Jaffe of Money Life.
Last year, WeWork filed plans to go public in what we called “The Most Ridiculous IPO of 2019.” WeWork quickly pulled its IPO as its valuation tumbled, and, in October 2019, we noted that its failed IPO was a win for main street.
However, that win didn’t last long. The next money-losing IPO that touts itself as much more of a transformational business than it actually is has arrived. Casper Sleep (CSPR: $18/share), the self-proclaimed “pioneer of the sleep economy”, is in the Danger Zone this week.
Don’t Bail Out Private Investors
At the top of Casper’s expected IPO price range, $17-$19/share, its valuation would be 30% below the $1.1 billion valuation from its private funding round in March 2019. Why would a fast growing e-commerce firm need to lower its valuation, if not to facilitate the unloading of the asset from the private investors to unsuspecting public investors?
Given its lack of profits and significant competition, no amount of buzzwords or “tech” focus can help justify this valuation. We outline the many red flags in Casper’s IPO below.
Red Flag #1: Profitless Revenue Growth
Casper was founded in 2014 and helped popularize the “bed-in-a-box” concept. Its mattresses are sold direct to consumer – thereby cutting out the middleman (mattress stores) – at a lower price than traditional mattresses. Since then, Casper has expanded into other products, such as pillows, sheets, duvets, and even bedroom furniture. Now, Casper has a WeWork-like mission to “awaken the potential of a well-rested world.”
Despite such an ambitious mission and rapid revenue growth, the company has made little progress towards profitability. Its economic earnings, the true cash flows of the business, declined from -$78 million in 2017 to -$95 million in 2018, per Figure 1. Revenue grew 43% over the same time.
Figure 1: CSPR’s Revenue & Economic Earnings: 2017-2018
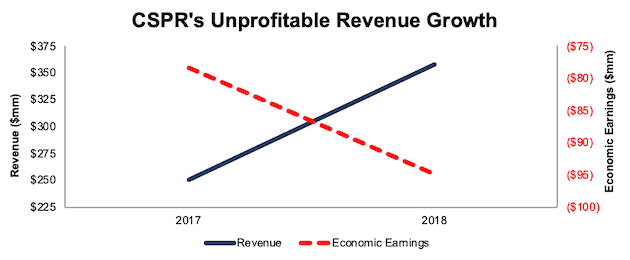
Sources: New Constructs, LLC and company filings
Red Flag #2: Revenue Growth is Already Slowing
As with other recent money-losing IPOs (e.g. Uber, Lyft, or Slack), the success of Casper’s IPO rests on hope that its rapid revenue growth is enough to distract investors from its growing losses.
However, just a few years after its founding, revenue growth is already slowing. From 2016-2018, Casper’s revenue grew 45% compounded annually. More recently, revenue grew just 20% year-over-year (YoY) through the first nine months of 2019, per Figure 2.
This revenue slowdown is not a byproduct of heavy sales coming in the last quarter of the year (as could be the case with traditional retailers). Per page 14 of its S-1, Casper expects revenue to grow 23% YoY for the year ended December 31, 2019.
Figure 2: CSPR’s Year-Over-Year Revenue Growth
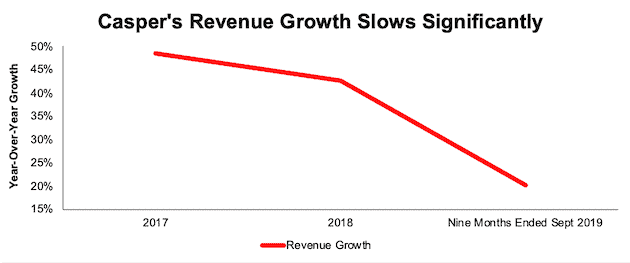
Sources: New Constructs, LLC and company filings
Casper’s direct-to-consumer sales (87% of 2018 revenue) were up nearly 42% YoY in 2018. For the nine months ended September 2019, direct-to-consumer revenue was up just 13% YoY, as disclosed on page 82 of Casper’s S-1.
An expected revenue growth rate of 23% is certainly nothing to balk at, but the rapid decline in just a few years, as competition continues to increase (more below), puts a damper on this “growth” story.
Red Flag #3: Competitors Are Profitable and Plentiful
Casper may have been one of the first “bed-in-a-box” concepts, but they’re not the last. Mattress review site GoodBed.com estimates there are ~175 “bed-in-a-box” companies in business, such as Leesa, Tuft & Needle, Nectar, and Purple (PRPL). Both Walmart (WMT) and Amazon (AMZN) also compete with their own mattress and bedding brands Allswell and AmazonBasics.
Casper also competes directly with traditional mattress manufacturers such as Sleep Number (SNBR), Tempur Sealy International (TPX), and Serta Simmons. As the firm expands into bedding and furniture, it enters into competition with the likes of Bed Bath & Beyond (BBBY), Wayfair (W), Overstock (OSTK) and other online retailers of consumer bedding goods.
For those still buying into the Casper hype, their numbers don’t compare well to the competition. Figure 3 compares Casper’s TTM fundamentals, as well as its expected price to sales, to some of its biggest competitors.
Figure 3: Analyzing Casper’s Fundamentals Vs. Competitors – TTM
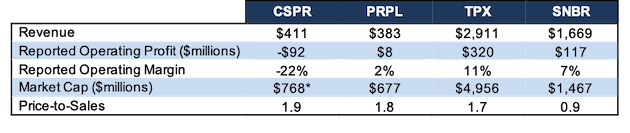
Sources: New Constructs, LLC and company filings
* Based on $19/share, the top of the IPO price range.
Given the negative reported operating margins and reported operating profit, it’s hard to justify a premium valuation for Casper. Worse yet, how can they justify a valuation higher than Purple, its profitable peer.
PRPL has similar revenues to CSPR and generates positive net operating profit after-tax (NOPAT) over the TTM period. But, is it worth 12% less than CSPR? Investors cannot make the argument that Casper is growing faster than PRPL, and therefore deserves a premium, either. Through the nine months ended September 2019, Casper’s revenue grew 20% YoY. Over the same time, Purple’s revenue grew 47%.
The comparison between the two reminds us again of WeWork’s now doomed IPO. When WeWork initially filed its S-1, we were quick to point out that IWG, a competing office leasing firm, was worth one-tenth of WeWork’s latest funding round valuation, despite greater revenues and actual profits.
Post WeWork, we think investors are less willing to overlook flaws in business models. Direct comparison between CSPR and PRPL makes it even more difficult to justify CSPR’s expected valuation.
Red Flag #4: Business Requires High Marketing Spend
Throughout its S-1, Casper touts its brand awareness, media impressions, and social media share (volume of public references to Casper across social media) as confirmation of its leading position in the sleep industry. Unfortunately for investors, Casper’s brand awareness has not come cheap, and the costs don’t look to be subsiding any time soon.
Through the nine months ended September 2019, sales and marketing expenses were 37% of revenue, up from 36% over the prior nine month period and 35% in 2018. Total operating expenses made up 71% of revenue through the nine months ended September 2019, up slightly from 70% over the prior nine month period. For comparison, PRPL’s total operating expenses for the nine months ended September 30, 2019 were just 38% of revenue.
More troubling than costs rising as a percent of revenue, Casper cannot cut out these expenses and generate meaningful recurring revenue, given mattresses’ multi-year replacement cycle. According to The Better Sleep Council (BSC), part of the International Sleep Products Association, the average mattress should be replaced every seven years. Even accounting for bias – the BSC was created to help mattress manufacturers shorten the mattress replacement cycle – you see that Casper’s target customers won’t be purchasing a mattress very often.
This long replacement cycle means Casper spends heavily to win a customer, but sees very little repeat business, thereby diminishing the return on customer acquisition costs. As Casper notes on page six of its S-1, since its beginning through September 30, 2019, just 16% of customers through its direct-to-consumer channel have returned to purchase another product. Casper may want to sound like a tech firm, emphasizing its data and insights, but its products have nowhere near the recurring revenue of a true tech firm.
Going forward, Casper has no plans to stop spending on sales & marketing, either. Page 31 of the S-1, in the Risk Factors section, states:
“If our operations are to continue to grow, of which there can be no assurance, we will be required to expand our sales and marketing, digital and technology teams, research and development, customer and commercial strategy, product offerings, supply, and manufacturing and distribution functions”.
The risk factors also note Casper will continue to add selling and general & administrative expenses to its operating profile in order to expand its direct-to-consumer presence and retail partnerships. Taken together, investors shouldn’t expect Casper’s costs to decline anytime soon, which means profitability, if it’s even achievable, is farther off than hoped.
Red Flag #5: An Acquisition Looks Unlikely
While less likely prior to an IPO, “stupid money risk” is always present. However, recent history would suggest that Casper is unlikely to be acquired anywhere near its expected valuation.
According to the New York post, Casper’s CEO and co-founder “has held off selling the startup numerous times in recent years because he’s been waiting for a $1 billion price tag.” The article points out that talks between Casper and Target (TGT) broke down in 2017 because Target’s offer was short of the $1 billion goal. Unless the CEO changes his mind, or is forced to by a large shareholder, investors shouldn’t hope for any acquisition premium when buying shares.
One Positive Sign: Public Shareholders Actually Have Rights
Possibly as a result of the criticism of WeWork during its IPO process, Casper did away with plans to go public with a dual-class share structure. Instead, upon completion of the IPO, its preferred stock will convert to a single class of common stock with one vote per share. Such a change is welcome and gives shareholders more ability to hold executives of the firm accountable for their actions.
However, this one positive is not enough to outweigh the red flags, especially CSPR’s valuation, as we’ll show below.
Red Flag #6: Growth Expectations Baked into Casper’s Valuation
It’s no coincidence that Casper has lofty goals such as “awaken the potential of a well-rested world” and that page one of the firm’s S-1 references “cutting-edge technology, data, and insights” before mentioning “mattresses”. In order to be valued higher than a traditional mattress and bedding manufacturer, CSPR must present itself as something much than a mattress/bedding company.
Unfortunately, the fundamentals of its business look worse than traditional mattress/bedding firms, and the expectations implied by the midpoint of its IPO price look overly optimistic. Below, we’ll use our reverse DCF model to quantify the expectations baked into the stock price.
To justify the midpoint of its IPO range, CSPR must immediately achieve a 6% NOPAT margin (equal to SNBR’s TTM margins) and grow revenue by 12% compounded annually for the next 11 years. See the math behind this reverse DCF scenario. For reference, Casper notes in its S-1 that the “Global Sleep Economy” is projected to grow by 6% compounded annually through 2024.
In other words, to justify its proposed IPO price, Casper must drastically increase margins from -24% in 2018 and grow by double the expected industry rate for more than a decade. We think investors can find better risk/reward elsewhere.
Given the majority of Casper’s sales occur direct-to-consumer, we can also compare its profitability to a more similar peer, Purple, to get a sense of what the firm could be worth.
If we assume CSPR can immediately achieve 2% NOPAT margins (equal to PRPL’s TTM margins) and grow revenue by 23% compounded annually for the next decade, the stock is worth just $9/share today – a 50% downside from the midpoint of its IPO price. See the math behind this reverse DCF scenario.
For reference, Casper expects 2019 sales to grow 23% YoY. This scenario assumes that growth rate continues for another nine years thereafter, despite revenue growth falling in recent years, and industry growth expected at just 6% compounded annually through 2024.
Critical Details Found in Financial Filings by Our Robo-Analyst Technology
As investors focus more on fundamental research, research automation technology is needed to analyze all the critical financial details in financial filings as shown in the Harvard Business School and MIT Sloan paper, "Core Earnings: New Data and Evidence”.
Below are specifics on the adjustments we make based on Robo-Analyst findings in Casper’s S-1:
Income Statement: we made $8 million of adjustments, with a net effect of removing $6 million in non-operating expense. See all adjustments made to CSPR’s income statement here.
Balance Sheet: we made $115 million of adjustments to calculate invested capital with a net increase of $115 million. The largest adjustment was $63 million (399% of reported net assets) in operating leases. See all adjustments made to CSPR’s balance sheet here.
Valuation: we made $362 million of adjustments with a net effect of decreasing shareholder value by $362 million. There were no adjustments that increased shareholder value. The largest adjustment was $239 million in preferred stock. This adjustment represents 34% of CSPR’s expected market cap. See all adjustments made to CSPR’s valuation here.
This article originally published on February 3, 2020.
Disclosure: David Trainer, Kyle Guske II, and Matt Shuler receive no compensation to write about any specific stock, style, or theme.
Follow us on Twitter, Facebook, LinkedIn, and StockTwits for real-time alerts on all our research.