We closed this position on May 6, 2022. A copy of the associated Position Update report is here.
AXA Equitable Holdings (EQH: $25.50/share midpoint of the IPO price range), the U.S. arm of French insurance giant AXA Group, will IPO on Thursday, May 10. At a price range of $24 to $27 per share, the company plans to raise $3.5 billion, which would make it the largest US IPO since Alibaba (BABA) in 2014.
Despite its size, EQH has attracted less attention than similarly sized IPO’s such as Dropbox (DBX) and Spotify (SPOT). As a financial firm, it’s not as “sexy” as those high-flying tech stocks, and its financial statements are difficult to sort through.
This report aims to help investors sort through the complex financial filings to understand the fundamentals and valuation of this IPO.
GAAP Earnings Understate Profit Growth
EQH consists of two primary businesses: AXA Equitable Life Insurance, and investment manager AllianceBernstein (AB), a subsidiary in which EQH has a controlling stake. The two businesses are separate but complementary, as AllianceBernstein manages a significant portion of AXA Equitable Life’s assets.
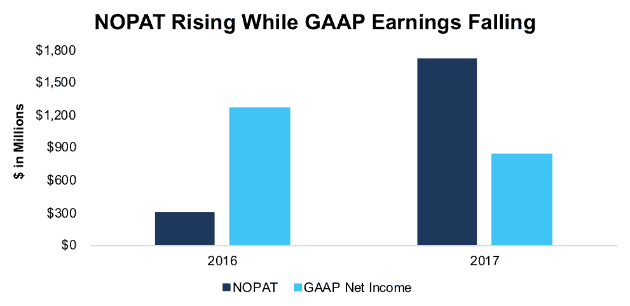
On the surface, those businesses appear to be struggling. GAAP net income decreased from $1.3 billion in 2016 to $840 million in 2017, a 34% decline. However, Figure 1 shows that after-tax operating profit (NOPAT) actually increased from $300 million to $1.7 billion in 2017.
Figure 1: EQH GAAP Net Income and NOPAT Since 2016
Sources: New Constructs, LLC and company filings
Non-operating items significantly overstated EQH’s profitability in 2016 and understated its profitability in 2017. For 2017, the Robo-Analyst[1] uncovered the following hidden non-operating expenses:
- A $369 million write-down of goodwill
- $93 million in non-recurring IPO-related expenses
- $83 million in restructuring costs
- Net $20 million one-time transition tax as a result of the new tax law
On the other hand, 2016 earnings were overstated due to $1.9 billion in pretax gain on the sale of two properties in New York City.
With only two years of history, it’s hard to draw any firm conclusions about the long-term trend in profitability for EQH, but our adjustments show that true profits increased significantly in 2017.
EQH is Undervalued Compared to Peers
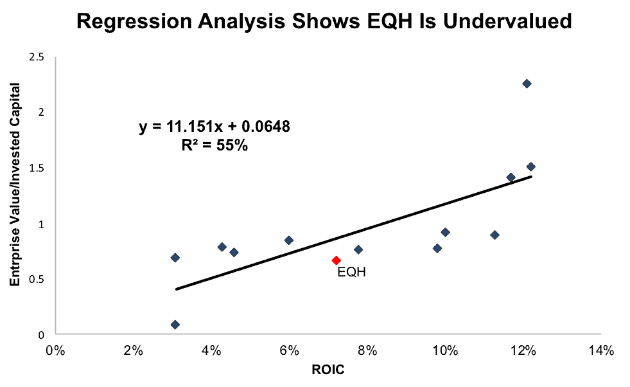
EQH’s NOPAT growth in 2017 helped its return on invested capital (ROIC) improve from 2% to 7%. This improvement is crucial because ROIC is the primary driver of valuation[2]. As Figure 2 shows, ROIC explains 55% of the difference in enterprise value per invested capital (a cleaner version of price to book) for the public companies that EQH listed as peers in its S-1.
Figure 2: ROIC vs. Enterprise Value/Invested Capital for EQH
Sources: New Constructs, LLC and company filings
If EQH were valued at the same level as its peers, it would be worth $29/share, 14% above the midpoint of the proposed offering range.
In other words, Figure 2 shows that at the proposed offering price, the market would be expecting EQH’s ROIC to decline to 5%. The market expects the company’s profitability to regress to the mean after its growth in 2017.
Low ROIC and Free Cash Flow Raise Red Flags
EQH’s rising profitability and cheap valuation help it earn our top rating in three out of the five categories that make up our stock rating methodology. In the other two categories, however, EQH earns our Unattractive and Very Unattractive rating.
Despite its improvement in profitability, EQH’s 7% ROIC remains fairly low. It’s below the 8% average ROIC for EQH’s peer group and puts the company in the bottom 40% of all companies we cover.
In addition, EQH’s invested capital significantly increased in 2017, from $19.8 billion to $27.8 billion. As a result, it had negative free cash flow of $6.3 billion.
EQH’s low ROIC and negative free cash flow counteract its other positive attributes, so the stock earns our Neutral Risk/Reward rating.
Auditable Impact of Footnotes and Forensic Accounting Adjustments
Our Robo-Analyst technology enables us to perform forensic accounting with scale and provide the research needed to fulfill fiduciary duties. In order to derive the true recurring cash flows, an accurate invested capital, and an accurate shareholder value, we made the following adjustments to AXA Equitable Holdings’ 2017 S-1:
Income Statement: we made $1 billion of adjustments, with a net effect of removing $883 million in non-operating expense (7% of revenue). We removed $71 million in non-operating income and $955 million in non-operating expenses. You can see all the adjustments made to EQH’s income statement here.
Balance Sheet: we made $1.9 billion of adjustments to calculate invested capital with a net increase of $1.1 billion. One of the largest adjustments was $1 billion due to off-balance sheet operating leases. This adjustment represented 4% of reported net assets. You can see all the adjustments made to EQH’s balance sheet here.
Valuation: we made $4.4 billion of adjustments with a net effect of decreasing shareholder value by $4.4 billion. There were no adjustments that increased shareholder value. The largest adjustment to shareholder value was $2.1 billion in minority interests. This adjustment represents 15% of EQH’s proposed market cap.
This article originally published on May 9, 2018.
Disclosure: David Trainer, Sam McBride and Kyle Guske II receive no compensation to write about any specific stock, style, or theme.
Follow us on Twitter, Facebook, LinkedIn, and StockTwits for real-time alerts on all our research.
[1] Harvard Business School features the powerful impact of research automation in the case New Constructs: Disrupting Fundamental Analysis with Robo-Analysts.
[2] Ernst & Young’s recent white paper “Getting ROIC Right” demonstrates the link between an accurate calculation of ROIC and shareholder value.