
Understanding Earnings Distortion[1], the difference between Core Earnings[2] and GAAP earnings, gives investors a materially better view of the fundamentals and valuations of stocks. Below, we feature the firms and sectors with the most Earnings Distortion, both overstated and understated GAAP earnings, in the S&P 500.
S&P 500 Constituents With the Most Under/Overstated Earnings
Figure 1 shows the S&P 500 companies with the most Earnings Distortion through 1Q21. We provide details on what causes the Earnings Distortion for two companies, AT&T (T) and Berkshire Hathaway (BRK.A) below.
Figure 1: S&P 500 Companies with Most Under/Overstated Earnings: TTM as of 1Q21
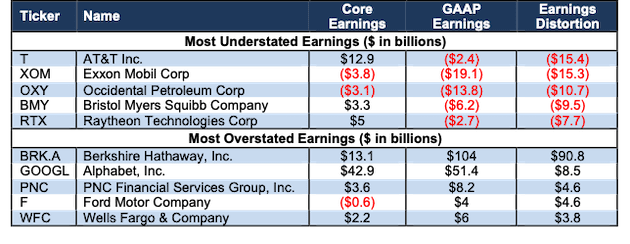
Sources: New Constructs, LLC and company filings.
AT&T’s Non-Operating Items Understate Earnings
Per Figure 1, AT&T has the most understated earnings post 1Q21. In its 2020 10-K and 1Q21 10-Q, AT&T disclosed multiple unusual items that were hidden in the footnotes of its filings. Detailed below, these hidden and reported unusual items amount to over $15.4 billion in TTM Earnings Distortion in 1Q21 and materially distort (by 629%) AT&T’s GAAP earnings.
Hidden Unusual Items, Net Gain = -$1.7 billion
- $1.2 billion in employee separation charges and benefit-related loss – Page 83 2020 10-K
- $900 million in gain on spectrum transaction – Page 83 2020 10-K
- $119 million gain on investments, net of impairments – Page 6 1Q21 10-Q
- $82 million in pre-tax loss – Page 92 2020 10-K
- $68 million in pre-tax gain – Page 91 2020 10-K
- $57 million in employee separation costs and benefit-related losses – Page 14 1Q21 10-Q
- $39 million in pre-tax gain – Page 92 2020 10-K
- $20 million in gain on repurchases – Page 26 1Q21 10-Q
Reported Unusual Items, Net Gain = -$17.5 billion
- $18.9 billion in asset impairments and abandonments – Page 66 2020 10-K
- $4.2 billion in other income – Page 3 1Q21 10-Q
- $1.4 billion in other expense – Page 66 2020 10-K
- $607 million adjustment for contra earnings distortion from recurring pension costs disclosed in non-recurring items
In addition, we made a $3.8 billion adjustment for income tax distortion. This tax adjustment normalizes reported income taxes by removing the impact of unusual items.
After removing Earnings Distortion, which totals -$2.14/share, or -629% of GAAP EPS, we find that AT&T’s 1Q21 TTM Core Earnings of $1.80/share are significantly higher than GAAP earnings of -$0.34/share.
Berkshire Hathaway’s Overstated Earnings
Many investors are aware of Berkshire Hathaway’s large unrealized gains in 2020, as Warren Buffett has been vocal about the accounting rule change that caused Berkshire’s “bottom-line to be useless”. However, the firm has several other hidden and reported unusual items in its 2020 10-K and 1Q21 10-Q that cause its earnings to be even more overstated. Detailed below, unusual items amount to over $90.8 billion in TTM Earnings Distortion in 1Q21 and materially distort (by 87%) GAAP earnings.
Hidden Unusual Items, Net Gain = -$1.2 billion
- $850 million in intangible asset impairment charges – Page K-86 2020 10-K
- $180 million in after-tax acquisition accounting expenses – Page 33 1Q21 10-Q
- $10 million in sublease income – Page K-90 2020 10-K
Reported Unusual Items, Net Loss = $117.4 billion
- $55 billion in change in unrealized investment gains during the year on securities held at the end of the period – Page K-87 (Page 89 overall) 2020 10-K
- $10.7 billion in goodwill and intangible asset impairments – Page K-72 (Page 74 overall) 2020 10-K
- $4.6 billion in change in investment gains during the period on securities held at the end of the period – Page 10 1Q21 10-Q
In addition, we made a -$25.3 billion adjustment for income tax distortion. This tax adjustment normalizes reported income taxes by removing the impact of unusual items.
After removing Earnings Distortion, which totals $57,787/share, or 87% of GAAP EPS, we find that Berkshire Hathaway’s 1Q21 TTM Core Earnings of $8,209/share are significantly lower than GAAP earnings of $66,141/share.
S&P 500 Core Earnings Vs. GAAP Earnings[3]
Core Earnings for the S&P 500 fell from a peak of $1.3 trillion in 2Q19 to $1.1 trillion in 4Q20 before rebounding to $1.2 trillion in 1Q21. Meanwhile, GAAP earnings fell from $1.2 trillion to $879 billion and rebounded to $1.1 billion over the same time.
Figure 2 shows the large disconnect between Core Earnings and GAAP earnings throughout 2020, which is largely a result of record write-downs sinking GAAP earnings. Prior to rebounding in 1Q21, GAAP earnings were understated by $179.5 billion in 4Q20, or more than any point since 2009 in the wake of the Financial Crisis. Such a disconnect means “record-earnings” beats are based on an artificially lower base when the true Core Earnings of S&P 500 firms, while depressed, were never nearly as low.
Figure 2: S&P 500 Core Earnings Vs. GAAP: 2004 – 1Q21[4]
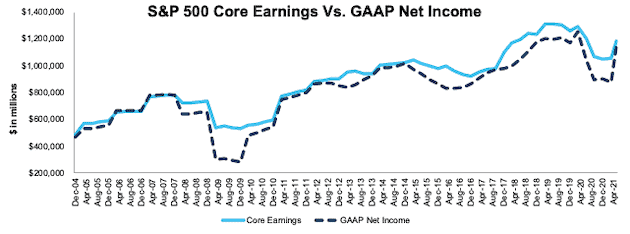
Sources: New Constructs, LLC and company filings.
Our Core Earnings analysis is based on aggregated TTM data for the index constituents.
Ranking the Sectors by Core Earnings Growth
Taking a closer look at S&P 500 sectors reveals all but four sectors (Real Estate, Consumer Cyclicals, Industrials, and Energy) saw a year-over-year (YoY) rise in Core Earnings in 1Q21. This widespread improvement in Core Earnings is a stark contrast to last quarter, when just four sectors saw a YoY increase in Core Earnings.
Figure 3 ranks all 11 S&P 500 sectors by the change in Core Earnings from 1Q20 to 1Q21.
Figure 3: 1Q21 Core Earnings Vs. Last year by S&P 500 Sector
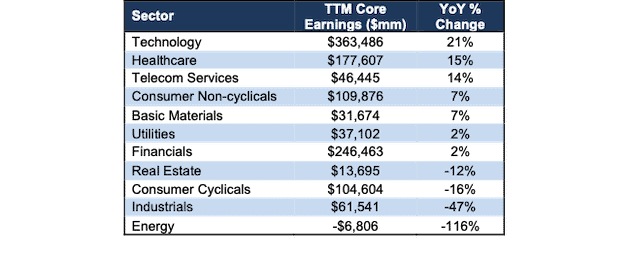
Sources: New Constructs, LLC and company filings.
Our Core Earnings analysis is based on aggregated TTM data for the sector constituents.
The Technology sector generates the most Core Earnings by far (nearly 1.5x the next closest sector) and grew Core Earnings by 21% YoY in 1Q21. On the flip side, the Energy sector has the lowest Core Earnings and the largest YoY drop in 1Q21.
Get Quarterly Updates on the S&P 500 and Its Sectors
Every quarter, we provide the latest look at Core Earnings and GAAP earnings for the S&P 500 and each of its sectors.
In addition to Core Earnings, we provide fundamental market and sector trends analysis in S&P 500 & Sectors: ROIC vs. WACC Through 1Q21, S&P 500 & Sectors: Free Cash Flow Yield Through 1Q21, and S&P 500 & Sectors: Price-to-Economic Book Value Through 1Q21. Additionally, we provide similar analysis of our all cap index, the NC 2000, which can be found here.
Details on the differences between Core Earnings and GAAP Earnings for each sector are in S&P 500 & Sectors: Core Earnings vs. GAAP Earnings Through 1Q21.
This article originally published on June 2, 2021.
Disclosure: David Trainer, Kyle Guske II, Alex Sword, and Matt Shuler receive no compensation to write about any specific stock, style, or theme.
Follow us on Twitter, Facebook, LinkedIn, and StockTwits for real-time alerts on all our research.
Appendix: Calculation Methodology
We derive the Core Earnings and GAAP Earnings metrics above by summing the Trailing Twelve Month individual S&P 500 constituent values for Core Earnings and GAAP Earnings in each sector for each measurement period. We call this approach the “Aggregate” methodology.
The Aggregate methodology provides a straightforward look at the entire sector, regardless of market cap or index weighting and matches how S&P Global (SPGI) calculates metrics for the S&P 500.
[1] The most recent Core Earnings and GAAP earnings values are based on the latest audited financial data, which is the calendar 1Q21 10-Q for most companies.
[2] Only Core Earnings enable investors to overcome the flaws in legacy fundamental data and research, as proven in Core Earnings: New Data & Evidence, a paper in The Journal of Financial Economics written by professors at Harvard Business School (HBS) & MIT Sloan.
[3] See the differences between Core Earnings and Operating Earnings from S&P Global in S&P 500 Is Still Priced for Continued Earnings Rebound.
[4] May 19, 2021 is earliest date for which all the calendar 1Q21 10-Qs for the S&P 500 constituents were available.