We published an update on the AZO Long Idea on January 12, 2022. A copy of the associated Earnings Update report is here.
We closed TJX on July 25, 2023. A copy of the associated Position Close report is here.
These two retailers have a long history of improving profits and taking market share. This week’s Long Ideas are AutoZone Inc. (AZO: $1,421/share) and The TJX Companies, Inc. (TJX: $67/share).
We leverage more reliable fundamental data, proven in The Journal of Financial Economics[1], with qualitative research to highlight these firms whose stocks present excellent risk/reward.
Figure 1: Long Idea Performance: From Date of Publication Through 5/25/2021
Sources: New Constructs, LLC
*Measured from the date of publication of each respective original report. Dates can be seen in each company section below. Performance represents price performance and is not adjusted for dividends.
Despite Large Gains, AutoZone Looks Cheap With 86%+ Upside
We made AutoZone a Long Idea in November 2018. Since then, the stock has outperformed the S&P 500 by 31%. We reiterated the stock in November 2020 and since then, the stock has outperformed the S&P 500 by 1%. Below, we show what we learned from its latest earnings release and why the stock still has more upside.
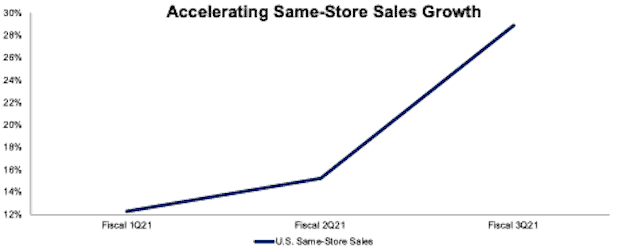
What’s Working: The increased interest in automotive do-it-yourself (DIY) helps drive AutoZone’s strong U.S. same-store sales. Since fiscal 1Q21, the rate of year-over-year (YoY) sales improved from 12% in fiscal 1Q21 to nearly 30% in fiscal 3Q21, per Figure 2.
Figure 2: AutoZone’s U.S. Same-Store Sales YoY Growth
Sources: New Constructs, LLC and company filings.
AutoZone has increased its share of its U.S. total addressable market (TAM), the U.S. automotive parts market, in each of its last three fiscal years through above average sales growth. In fiscal 2020, AutoZone’s U.S. same-store sales grew 7% compared to U.S. market growth of less than 1%.
AutoZone’s growing commercial supplier business also helps drive the firm’s market share gains. In fiscal 2020, AutoZone’s U.S. commercial sales accounted for 22% of total sales, up from 20% in fiscal 2018. In fiscal 3Q21, the firm’s commercial sales grew 44% YoY.
AutoZone’s growth is likely to continue as used car sales remain strong and vehicles on the road keep getting older. The average U.S. vehicle on the road was 11.9 years old in 2020, which is up from 11.7 years in 2018. Conventional vehicles in the U.S. are expected to increase by 36 million (13% of 2020 U.S. fleet) from 2020 to 2030.
Lastly, and key to AutoZone’s ability to create lasting shareholder value, the firm compensates its executives with annual cash incentives linked to return on invested capital (ROIC) objectives. There is a strong correlation between improving ROIC and increasing shareholder value, which is exactly what AutoZone’s focus on ROIC has helped deliver. AutoZone’s ROIC improved from 23% in fiscal 2016 to 28% over the TTM while economic earnings rose from $1.1 billion to $1.7 billion over the same time.
What’s Not Working: The emerging electric vehicle (EV) market is less of a threat than most investors think. While it is true that EVs have fewer parts and lower maintenance costs, their maintenance costs are only 26% lower than conventional vehicles[2]. Furthermore, it will likely take years for the U.S. fleet to transition from conventional to EVs. EVs are currently less than 1% of the U.S. fleet, and are projected to make up just 35% of the U.S. fleet by 2035.
Another threat to AutoZone’s impressive ROIC is its focus on growing its commercial business. Commercial sales traditionally are lower margin than retail/DIY sales, which means the firm’s outstanding record of ROIC growth could be in jeopardy if it is unable to offset lower margins with higher invested capital turns.
Priced for Permanent Profit Decline: AutoZone’s price-to-economic book value (PEBV) ratio is 0.7. This ratio implies that the market expects AutoZone’s profits to permanently decline by 30%.
Below, we use our reverse discounted cash flow (DCF) model to analyze the expectations for future growth in cash flows baked into AutoZone’s current share price.
In this scenario, we assume AutoZone performs as follows during fiscal 2021-2030:
- net operating profit after tax (NOPAT) margin falls to 15% (five-year average vs. 16% TTM) and
- revenue falls by 2% (vs. consensus expectations for a CAGR of +5%) compounded annually.
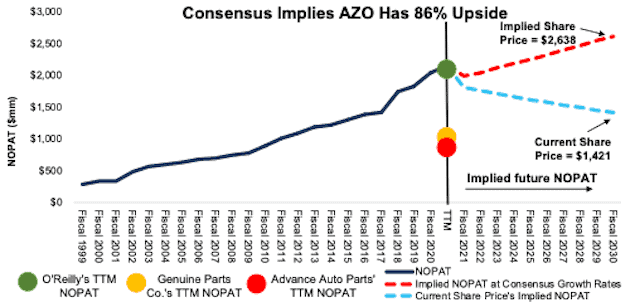
In this scenario, AutoZone’s NOPAT falls 4% compounded annually over the next decade and the stock is worth $1,421/share today – equal to the current price. See the math behind this reverse DCF scenario. For reference, AutoZone grew NOPAT by 9% compounded annually over the past two decades.
Shares Could Reach $2,600 or Higher: If we assume AutoZone performs as follows during fiscal 2021-2030:
- NOPAT margin falls to 15%,
- revenue grows by 5% (equal to consensus expectations) from fiscal 2021-2023, and
- revenue grows by 3% (below its 10-year CAGR of 6%) each year thereafter through fiscal 2030, then
the stock is worth $2,638/share today – 86% above the current price. See the math behind this reverse DCF scenario. In this scenario, AutoZone grows NOPAT 3% compounded annually over the next decade.
Over the past decade, AutoZone grew NOPAT by 9% compounded annually. Should AutoZone grow profits closer to historical levels, the upside is even greater.
Figure 3: AutoZone’s Historical and Implied NOPAT: DCF Valuation Scenarios
Sources: New Constructs, LLC and company filings
TJX Companies: Still Has 33%+ Upside
We made TJX Companies a Long Idea in April 2018. Since then the stock has outperformed the S&P 500 by 2%. However, since reiterating the pick in March 2020, the stock has underperformed the S&P 500 by 26%. Despite its recent underperformance, we still like TJX’s risk/reward.
What’s Working: As a brick-and-mortar retailer, the COVID-19 pandemic largely disrupted TJX Companies’ fiscal 2021 business. However, as the firm reopens more of its stores, sales are quickly recovering. The firm’s fiscal 1Q22 sales were up 129% YoY and up 9% from pre-pandemic levels in fiscal 1Q20.
TJX Companies’ brick-and-mortar strategy is buoyed by the popular bargain hunting experience it offers customers. The firm leverages unique supply opportunities to curate an appealing inventory mix filled with brand name items at low prices. TJX Companies’ opportunistic sourcing model and customer experience creates a competitive advantage that is difficult to profitably replicate online. Additionally, recent bankruptcies by other retailers could help the firm in the near term source cheap inventory from recently defunct operations.
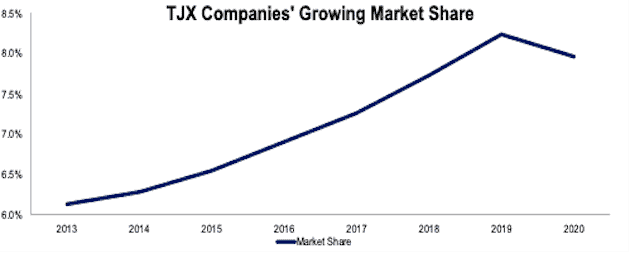
The firm’s successful business model has led to years of market share gains. TJX Companies’ share of its U.S. TAM, which includes clothing, accessories, furniture, and home furnishings, grew from 6% in calendar 2013 to 8% in calendar 2020.
Figure 4: TJX Companies Share of U.S. TAM From Calendar 2013 - 2020
Sources: New Constructs, LLC, company filings & Federal Reserve Economic Data.
While TJX Companies’ share of its U.S. TAM slightly fell in calendar 2020, we believe this is primarily the result of 24% of its stores being closed during fiscal 2021 and a very limited online sales presence (less than 3% of fiscal 2020 sales). Despite the temporary closure of so many stores, TJX Companies’ share of the U.S. home furnishing market was unchanged YoY in calendar 2020.
Furthermore, TJX Companies’ U.S. operations weathered the economic downturn better and took market share away from off-price competitors Ross Stores (ROST) and Burlington Stores (BURL). TJX Companies’ U.S. revenue fell 20% YoY in fiscal 2021 compared to 21% for Burlington Stores and 22% for Ross Stores over the same time.
Before the pandemic, TJX Companies delivered 24 consecutive years of same-store sales growth. Though that streak is no longer intact, looking forward, TJX Companies has plenty of growth opportunities. With the increase in work-from-home and growing interest from first-time home buyers, TJX Companies’ home goods segment is positioned for continued sales growth. Additionally, fiscal 1Q22 open-only same-store sales[3] grew 40% YoY. TJX Companies also has plenty of opportunity to grow by opening new stores. In the countries in which it operates, the firm estimates it can open an additional 1,600 stores, or 34% of its 4,639 stores at the end of fiscal 1Q22.
What’s Not Working: While other stores with a developed omnichannel business, such as Walmart (WMT), Williams-Sonoma (WSM), and Target (TGT), grew sales during the pandemic, TJX Companies faced large temporary store closures. With its reliance on the brick-and-mortar model, the firm had little opportunity to engage in business while its stores were shuttered.
The firm still faces temporary store closures, with 14% of its stores temporarily closed in fiscal 1Q22. However the firm expects that just 3% of its stores will be closed in fiscal 2Q22. If stores do not open as soon as the firm expects, sales in 2Q22 could disappoint.
Longer term, ReportLinker expects global fashion ecommerce sales to grow by 16% compounded annually through 2025. The growing prevalence of online apparel sales could change consumer behavior and pose a long-term threat to TJX Companies’ treasure hunt offering. However, we believe TJX Companies gives customers a unique experience that online platforms cannot replicate.
Furthermore, the firm does recognize a need to expand its online presence in a targeted way and expects to launch a Home Goods e-commerce channel in fiscal 2022. By focusing on higher-dollar ticket items from its home furnishings segment, the firm might be able to profitably replicate the online success of other home furnishings firms such as Williams-Sonoma.
Current Price Assumes Very Slow Recovery: Below, we use our reverse DCF model to analyze the expectations for future growth in cash flows baked into TJX Companies’ current stock price.
In this scenario, we assume TJX Companies performs as follows through fiscal 2031:
- NOPAT margin rises to 9% (3-year pre-pandemic average from fiscal 2018-2020) and
- revenue grows annually by 5% (vs. consensus expectations for CAGR of 18% from fiscal 2022-2024).
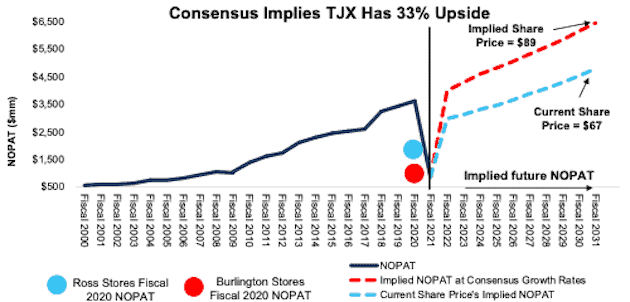
In this scenario, TJX Companies’ NOPAT grows by 3% compounded annually from its pre-pandemic levels in fiscal 2020 to fiscal 2031 and the stock is worth $67/share today – equal to the current price. See the math behind this reverse DCF scenario. For reference, TJX Companies grew NOPAT by 10% compounded annually from fiscal 2010 to fiscal 2020.
There’s 33%+ Upside: If we assume, the firm performs as follows through fiscal 2031:
- NOPAT margin is 9%, and
- revenue grows by 18% compounded annually from fiscal 2022-2024 (equal to consensus estimate over same time) and
- revenue grows by 5% compounded annually from fiscal 2025-2031, which is below its 7% CAGR from fiscal 2010-2020, then
the stock is worth $89/share today, or 33% above the current price. See the math behind this reverse DCF scenario.
In this scenario, TJX Companies’ NOPAT grows by 5% compounded annually from its pre-pandemic levels in fiscal 2020 to fiscal 2031. For reference, from fiscal 2000-2020, TJX Companies grew NOPAT by 10% compounded annually. If TJX Companies’ grows NOPAT in line with historical levels, the stock has even more upside.
Figure 5: TJ Maxx’s Historical and Implied NOPAT: DCF Valuation Scenarios
Sources: New Constructs, LLC and company filings
Other Long Ideas That Recently Reported Earnings
Figure 6 shows two other Long Ideas that have recently reported calendar 1Q21 earnings along with their relative performance to the S&P 500.
Figure 6: More Long Ideas That Recently Reported Earnings: Through 5/25/2021
| Company | Ticker | Date Published | Earnings Date | Outperformance vs. S&P 500* |
| Target Corporation | TGT | 4/28/15 | 5/19/21 | 78% |
| Cracker Barrel Old Country Store | CBRL | 4/29/20 | 5/25/21 | 12% |
Sources: New Constructs, LLC
* Measured from the date of publication of each respective report. Performance represents price performance and is not adjusted for dividends.
This article originally published on May 26, 2021.
Disclosure: David Trainer, Kyle Guske II, and Matt Shuler receive no compensation to write about any specific stock, sector, style, or theme.
Follow us on Twitter, Facebook, LinkedIn, and StockTwits for real-time alerts on all our research.
[1] Our reports utilize our Core Earnings, a more reliable measure of profits, as demonstrated in Core Earnings: New Data & Evidence, a paper by professors at Harvard Business School (HBS) & MIT Sloan published by the Journal of Financial Economics.
[2] A recent AAA study estimates the average annual maintenance costs for EVs is $949 compared to $1,279 for conventional vehicles.
[3] TJX Companies’ open-only same-store sales measures the same-store sales of each day a store was open in fiscal 1Q22 compared to the same day in fiscal 1Q20, prior to the pandemic.


