We closed the AMGN Long Idea on May 30, 2025. A copy of the associated Position Close report is here.
We published an update on CL on May 11, 2022. A copy of the associated Earnings Update report is here.
We published an update on MCD on May 4, 2022. A copy of the associated Earnings Update report is here.
We continue with more updates to Long Ideas that recently reported calendar 1Q21 earnings. This week, we’re reiterating three Long Ideas that have underperformed the S&P 500 since our original reports: Amgen, Inc (AMGN: $247 /share), McDonald’s Corporation (MCD: $234/share), and Colgate-Palmolive Company (CL: $81/share). More details in Figure 1.
We leverage more reliable fundamental data, proven in The Journal of Financial Economics[1], with qualitative research to highlight these firms whose stocks present excellent risk/reward.
Figure 1: Long Idea Performance: From Date of Publication Through 5/4/2021
Sources: New Constructs, LLC
*Measured from the date of publication of each respective original report. Dates can be seen in each company section below. Performance represents price performance and is not adjusted for dividends.
Amgen: Looks Cheap at Current Price with 66%+ Upside
We made Amgen a Long Idea in May 2017 and reiterated the pick in December 2018. Though the stock has underperformed, we still like its risk/reward profile.
What’s Working: Amgen’s expertise in developing human therapeutics enables it to diversify revenues across several products. For instance, the firm’s top eight products accounted for 71% of the firm’s revenues in 1Q21. Repatha, a product that treats cardiovascular disease, saw the largest year-over-year (YoY) growth, with revenue rising 25% in 1Q21. With its earliest patent not set to expire until 2028, Repatha has a long runway for future revenue growth.
The number of products in phase 3 clinical trials, the last phase before receiving FDA approval, is a good indicator of how many new products could come into production in the coming years to offset the decline of older products whose patents have expired.
Amgen has increased its number of products in phase 3 clinical trials from eight in February 2019 to thirteen in February 2021. For reference, the average success rate for all phase 3 clinical trials across all disease areas is ~58%. After successful phase 3 trials, firms must also seek approval to sell and market the product. On average, 90% of products with successful phase 3 trials obtain marketing approval. If Amgen matches the average success rates for phase 3 clinical trials and marketing approval applications, the firm will add at least another six products to its existing portfolio.
Beyond developing new products, international markets are a key driver of Amgen’s growth strategy. International revenue as a percent of total revenue increased from 21% in 2017 to 30% in 1Q21. While the majority of the firm’s international sales are in Europe, Amgen intends to increase its presence in the Asia Pacific market to drive future growth.
Amgen is also investing heavily in its biosimilar business. Biosimilars are lower priced competitive products that utilize previously-approved technology, but are not direct copies of a patented product. Though Amgen only received its first regulatory approval for a biosimilar product in 2016, management noted in its 1Q21 earnings call that its biosimilars portfolio has annualized sales of more than $2 billion (8% of TTM revenue).
Lastly, Amgen’s strong free cash flow (FCF) generation funds the firm’s R&D, which helps sustain its product pipeline. Since 2016, Amgen generated $37.1 billion (27% of market cap) in FCF. Over the TTM, the firm generated $11.5 billion in FCF.
What’s Not Working: Amgen’s revenue in 2020 was adversely affected by the pandemic as many patients forewent doctor visits and, consequentially, therapeutic treatments. Older patients, a key customer group for Amgen, were particularly reluctant to visit doctors. These impacts lingered into 1Q21, as the firm noted COVID-19 continues to negatively impact patient visits and diagnoses.
While we expect patients will eventually return to doctors after the pandemic, Amgen is facing a long-term decline in the sales of its leading product Enbrel, which has hurt the firm’s profitability. Amgen’s net operating profit after tax (NOPAT) fell from $9.4 billion in 2017 to $8.5 billion in 2019 and fell even lower in 2020 to $7.8 billion.
Priced for Permanent Profit Decline: Amgen’s price-to-economic book value (PEBV) ratio is 0.8. This ratio implies that the market expects Amgen’s already depressed profits will permanently decline another 20%.
Below, we use our reverse discounted cash flow (DCF) model to analyze the expectations for future growth in cash flows baked into Amgen’s current stock price.
In this scenario, we assume Amgen’s:
- NOPAT margin immediately falls to 29% (10-year low) in 2021 through 2030, and
- revenue falls by 2% (vs. consensus estimate CAGR of +3% from 2021 to 2025) compounded annually through 2030.
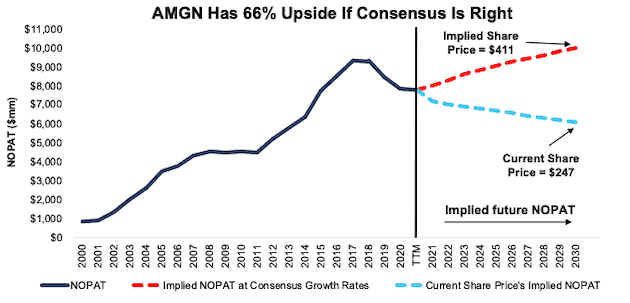
In this scenario, Amgen’s NOPAT falls by 3% compounded annually over the next decade and the stock is worth $247/share today – equal to the current price. See the math behind this reverse DCF scenario. For reference, Amgen grew NOPAT by 6% compounded annually over the past decade.
There’s 66%+ Upside: If we assume:
- Amgen maintains its 2020 NOPAT margin of 31% (seven-year low) in 2021 through 2030, and
- revenue grows by 3% (equal to consensus estimate CAGR from 2021 to 2025) compounded annually from 2021 to 2025, and
- revenue grows by 2% compounded annually from 2026-2030 (compared to 5% CAGR from 2010 to 2020) then,
the stock is worth $411/share today, or 66% above the current price. See the math behind this reverse DCF scenario.
In this scenario, Amgen’s NOPAT grows just 3% compounded annually over the next decade. This scenario includes conservative margin and revenue assumptions to illustrate just how negative the expectations for future cash flows are in AGMN’s current price. Given that Grand View Research expects the global biotechnology market to grow ~16% compounded annually from 2021 to 2028, Amgen’s profit growth could exceed the assumptions in this scenario and give the stock even more upside.
Figure 2: Amgen’s Historical and Implied NOPAT: DCF Valuation Scenarios
Sources: New Constructs, LLC and company filings
McDonald’s Still Has 21%+ Upside
We made McDonald’s a Long Idea in December 2018 and reiterated it in December 2019. Here’s what we learned from 1Q21 earnings and why the stock still provides quality risk/reward despite its underperformance.
What’s Working: McDonald’s has consistently improved its share of its total addressable market (TAM), the global informal eating out segment, from 7% in 2015 to 8.4% in 2019. While the firm hasn’t yet disclosed its 2020 market share, management noted in its 4Q20 earnings call that the firm “continued growing market share during COVID.”
Economies of scale enable McDonald’s to be the lowest-cost fast food provider, invest in training, maintain brand uniformity, and invest in technology such as artificial intelligence to improve the customer experience and operational efficiency.
McDonald’s best-in-class distribution provides consistent quality, customer experience, and attractive menu items across nearly 1.5x more stores than Burger King (QSR), Wendy’s (WEN), and Jack in the Box (JACK) combined. While other restaurants were shutting their doors for good, McDonald’s restaurant count rose from 38,695 at the end of 2019 to 39,198 at the end of 2020.
The shift in consumer demand towards restaurant takeout during the pandemic plays into McDonald’s strengths. McDonald’s successfully transitioned many of its customers to its digital platform, which now accounts for 20% of its system wide sales in its top six markets. At the end of 2020, more than 30,000 (~75% of its total restaurants) of the firm’s restaurants offered delivery, up from just over 3,000 in 2016. By focusing on its world-class drive thru operation, expanding delivery, and engaging with customers digitally, the firm generated over $4.5 billion (3% of market cap) in FCF in 2020.
Though McDonald’s focused on its core menu items of burgers, chicken, fries, and coffee during the pandemic, the firm historically offers innovative menu items to attract customers. The firm leverages Its network of locally owned franchises to test a variety of new items that, if they prove to be successful, can be rolled out across the McDonald’s network.
McDonald’s scale and technological advantages drive its superior profitability to its peers as well. McDonald’s TTM return on invested capital (ROIC) of 13% dwarfs the TTM ROIC of its closest peers, Restaurant Brands International which owns Burger King, Wendy’s, and Jack in the Box.
What’s Not Working: The pandemic forced many traditional restaurants to quickly develop their digital and takeout capabilities, which creates more options for consumers and competition for McDonald’s. However, McDonald’s cost advantage, speed of service, technological advancement, and lower price points should enable the firm to continue to effectively compete in the takeout market.
Though the firm has had the “unhealthy” stigma for many years, large numbers of people still frequent McDonald’s. McDonald’s is tied with Starbucks at 15 out of the top 105 most loved millennial consumer brands.
Current Price Has Upside With Only Moderate Profit Growth: Below, we use our reverse DCF model to analyze the expectations for future growth in cash flows baked into MCD’s current price.
In this scenario, we assume:
- McDonald’s NOPAT margin slightly falls to 31.5% (which is the firm’s five-year average compared to 31.6% in 2020) in 2021 through 2030 and
- revenue grows by 7% (vs. consensus estimate CAGR of 9% from 2021 to 2023) compounded annually from 2021 to 2023 and
- revenue grows by 3% compounded annually from 2024 to 2030, which is below the average annual global GDP growth rate of 3.5% since 1961.
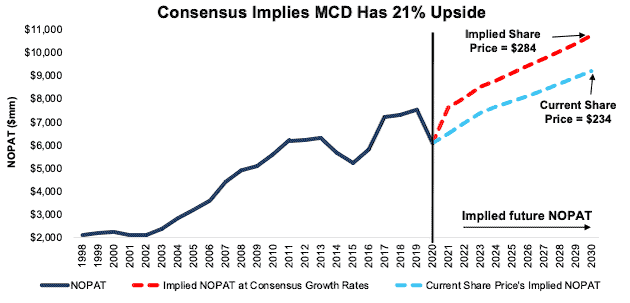
In this scenario, McDonald’s NOPAT grows just 2% compounded annually from its pre-pandemic NOPAT levels in 2019 to 2030 and the stock is worth $234/share today – equal to the current price. See the math behind this reverse DCF scenario. For reference, McDonald’s grew NOPAT by 6% compounded annually from 2014 to 2019.
$284/Share If Consensus Is Right: If we assume:
- McDonald’s NOPAT margin improves to 34% (three-year average) in 2021 through 2030 and
- revenue grows by 9% (equal to consensus estimates) compounded annually from 2021 to 2023 and
- revenue grows by 3% compounded annually each year thereafter through 2030, which is below the average annual global GDP growth rate of 3.5% since 1961, then
the stock is worth $284/share today, or 21% above the current price. See the math behind this reverse DCF scenario. In this scenario, McDonald’s NOPAT grows 6% compounded annually from 2020 to 2030, or just slightly above global fast food market expectations of 5% compound annual growth from 2020 to 2027. If McDonald’s sales grow any faster, then MCD has even more upside.
Figure 3: McDonald’s Historical and Implied NOPAT: DCF Valuation Scenarios
Sources: New Constructs, LLC and company filings
Colgate-Palmolive Has 52%+ Upside
We made Colgate-Palmolive a Long Idea in May 2018. Despite its underperformance, CL remains a Long Idea post 1Q21 earnings.
What’s Working: Colgate-Palmolive has strong brands and a vast distribution network that position it as the number one or number two market share leader in seven categories within its three operating segments. Smaller competitors cannot match Colgate-Palmolive’s distribution network and retail shelf space.
Colgate-Palmolive’s organic sales reveal the strength of its products. In 2020, organic sales grew 7% YoY, and in 1Q21, the company reported that organic sales improved 5% YoY.
In addition to organic growth, Colgate-Palmolive makes smart acquisitions that create shareholder value. Since 2018, the firm has acquired four businesses, while its economic earnings rose from $2.2 billion to $2.5 billion over the same time.
To maintain the long-term relevancy and popularity of its brands, Colgate-Palmolive invests in technology and artificial intelligence to help address changing market trends. More recently, Colgate-Palmolive’s innovations are also directed toward sustainable products, which are increasingly more important to consumers. Colgate-Palmolive now offers a plastic-free toothbrush with plastic-free packaging and toothpaste in 100% recyclable tubes.
Colgate-Palmolive’s large distribution network, strong market position, and innovative products generate cash, and lots of it. Over the past five years, the firm generated $11.7 billion (17% of market cap) in FCF.
What’s Not Working: While most companies cannot compete with Colgate-Palmolive’s’ distribution network and shelf space, some use a direct to consumer (DTC) model to avoid traditional middleman stores. Whatever cost advantages these DTC businesses gain by avoiding traditional retailers is diminished through higher shipping costs and the cost of directly advertising to consumers through the likes of Google (GOOGL) and Facebook (FB). However, Colgate-Palmolive’s online business, which directly competes with DTC businesses, is growing and now accounts for over 10% of the firm’s total revenue.
A sharp rise in raw material costs threatens the firm’s margins and profitability as it does all of Colgate-Palmolive’s competitors. Nevertheless, the firm’s planned price increases could cost it market share, profits, or both.
Lastly, professional skincare products saw a decline in revenue as spas, dermatologists, and travel retail operated at reduced levels in 2020. However, we view 2020’s decline as temporary and a rebound in 2021 could provide the firm a strong year-over-year revenue boost.
Current Price Still Leaves Upside: Despite its strong competitive position, Colgate-Palmolive’s PEBV ratio is 0.8. This ratio implies that the market expects Colgate-Palmolive’s profits to permanently decline by 20%.
Below, we use our reverse DCF model to analyze the expectations for future growth in cash flows baked into Colgate-Palmolive’ current share price.
In this scenario, we assume Colgate-Palmolive’s:
- NOPAT margin immediately falls to 18% (five-year low) from 2021 through 2030, and
- venue falls by 2% (vs. consensus revenue estimate CAGR of +4% through 2023) compounded annually for the next decade
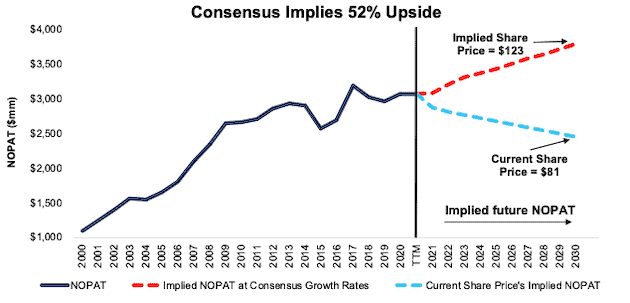
In this scenario, Colgate-Palmolive’s NOPAT falls by 2% compounded annually over the next ten years and the stock is worth $81/share today – equal to the current price. See the math behind this reverse DCF scenario. For reference, Colgate-Palmolive grew NOPAT by 4% compounded annually over the past five years.
Shares Could Reach $123 or Higher: If we assume Colgate-Palmolive’s:
- NOPAT margin immediately falls to 18% (five-year low) from 2021 through 2030,
- revenue grows by 4% (equal to consensus revenue estimates) compounded annually from 2021 to 2023, and
- grows revenue by 2% each year thereafter through 2030, which is below the average annual global GDP growth rate since 1961, then
the stock is worth $123/share today – 52% above the current price. See the math behind this reverse DCF scenario. In this scenario, Colgate-Palmolive’s NOPAT grows 2% compounded annually over the next decade.
For reference, the firm grew NOPAT 6% compounded annually over the past two decades. Going forward, ReportLinker expects global beauty and personal care products to grow 4.4% from 2020 to 2025 and Mordor Intelligence expects the global pet food market (Colgate-Palmolive offers pet food products through its Hill’s brand) to grow 4.8% over the same time. If Colgate-Palmolive’s profits grow in line with industry projections, CL has even more upside.
Figure 4: Colgate-Palmolive’s Historical and Implied NOPAT: DCF Valuation Scenarios
Sources: New Constructs, LLC and company filings
Other Long Ideas That Recently Reported Earnings
Figure 5 shows seven other Long Ideas that have recently reported their calendar 1Q21 earnings along with their relative performance to the S&P 500.
Figure 5: More Long Ideas That Recently Reported Earnings: Through 5/4/2021
| Company | Ticker | Date Published | Earnings Date | Out (under)performance vs. S&P 500* |
| Caterpillar Inc. | CAT | 5/27/2020 | 4/29/2021 | 53% |
| SYSCO Corporation | SYY | 4/15/2020 | 5/4/2021 | 31% |
| Hyatt Hotels | H | 5/14/2020 | 5/4/2021 | 27% |
| Cummins Inc. | CMI | 11/14/2018 | 5/4/2021 | 21% |
| Phillips 66 | PSX | 7/29/2020 | 4/30/2021 | (1%) |
| The Hershey Company | HSY | 8/12/2020 | 4/29/2021 | (9%) |
| Western Union Co | WU | 9/12/2018 | 5/4/2021 | (10%) |
Sources: New Constructs, LLC
* Measured from the date of publication of each respective report. Performance represents price performance and is not adjusted for dividends.
This article originally published on May 5, 2021.
Disclosure: David Trainer owns SYY and H. David Trainer, Kyle Guske II, and Matt Shuler receive no compensation to write about any specific stock, sector, style, or theme.
Follow us on Twitter, Facebook, LinkedIn, and StockTwits for real-time alerts on all our research.
[1] Our reports utilize our Core Earnings, a more reliable measure of profits, as demonstrated in Core Earnings: New Data & Evidence, a paper by professors at Harvard Business School (HBS) & MIT Sloan. Recently accepted by the Journal of Financial Economics, the paper proves that our data is superior to all the metrics offered elsewhere.


