We closed the LEA Long Idea on January 24, 2024. A copy of the associated Position Close report is here.
We closed the MTZ Long Idea on August 17, 2023. A copy of the associated Position Close report is here.
We published an update on ALL on November 10, 2022. A copy of the associated Earnings Update report is here.
After 1Q21 earnings, we still love these three Long Ideas that have excellent profit growth opportunities and attractive risk/reward. This week’s Long Ideas are MasTec Company (MTZ: $118/share), Allstate, Inc. (ALL: $134/share), and Lear Corporation (LEA: $186/share).
We leverage more reliable fundamental data, proven in The Journal of Financial Economics[1], with qualitative research to highlight these firms whose stocks present excellent risk/reward.
Figure 1: Long Idea Performance: From Date of Publication Through 5/11/2021
Sources: New Constructs, LLC
*Measured from the date of publication of each respective original report. Dates can be seen in each company section below. Performance represents price performance and is not adjusted for dividends.
Despite Large Gains, MasTec Still Has 19%+ Upside
We made MasTec a Long Idea in June 2020. Since then, the stock has outperformed the S&P 500 by 153% and still has more upside. See last quarter’s update on MasTec here.
What’s Working: Since 2015, MasTec’s return on invested capital (ROIC) has improved from 2% to 9% over the trailing-twelve-months (TTM). More recently, Core Earnings[2] improved from $30 million in 1Q20 to $65 million in 1Q21. The firm’s 18-month backlog of $7.9 billion (118% of TTM revenue) is unchanged quarter-over-quarter and indicates continued demand for MasTec’s products/services.
MasTec recently acquired INTREN, which strengthens its electrical transmission business. In addition to electrical distribution services, many of INTREN’s existing customers also need natural gas infrastructure and clean energy services, which open up cross-selling opportunities across other MasTec segments.
The INTREN deal positions the firm to capitalize on growing electrical demand due to the rise of electric vehicles (EVs) and an infrastructure bill targeting $100 billion of improvements to the U.S. power grid. Boston Consulting group estimates a typical utility will need to spend $1,700 to $5,800 per EV on the road in grid upgrades through 2030. If we assume a midpoint grid expense of $3,755 per EV, the U.S. would require ~$70 billion of electric upgrades to support Edison Electric Institute’s expected 18.7 million EVs on U.S. roads in 2030.
In addition to power grid upgrades, MasTec is also well positioned to benefit from other expected infrastructure spending, with a proposed $46 billion going toward clean energy manufacturing and $100 billion toward the broadband industry.
What’s Not Working: Revenue from the firm’s oil and gas segment fell from $3.3 billion in 2018 to just $1.8 billion in 2020. However, the oil and gas segment is seeing a rebound as revenue in 1Q21 doubled to $726 million from just $359 million in 1Q20.
MasTec’s business is highly concentrated in its top two customers, Enbridge (ENB) and AT&T (T), which combined for 36% of its total revenue in 1Q21. Losing a major customer could significantly lower the firm’s revenue. However, this risk is much lower than in the past, when the firm’s top two customers accounted for 53% of total revenue in 1Q18.
Current Price Still Leaves Upside: Below, we use our reverse discounted cash flow (DCF) model to analyze the expectations for future growth in cash flows baked into MasTec’s current share price.
In this scenario, we assume MasTec:
- maintains its TTM net operating profit after tax (NOPAT) margin of 6% (vs. five-year average of 5%) from 2021 through 2030, and
- grows revenue by 7% (vs. consensus revenue estimate CAGR of 16% for 2021 and 2022) compounded annually from 2021 to 2030
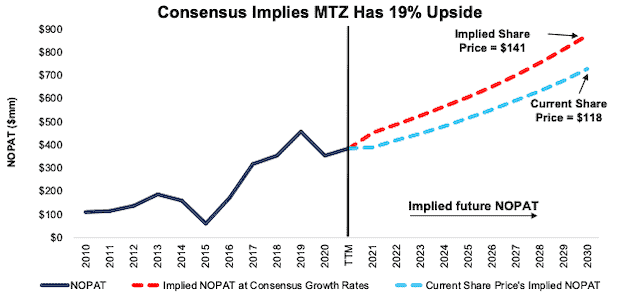
In this scenario, MasTec’s NOPAT grows by just 4% compounded annually from 2019 to 2030 and the stock is worth $118/share today – equal to the current price. See the math behind this reverse DCF scenario. For reference, MasTec grew NOPAT by 12% compounded annually from 2010 to 2020 and 8% compounded annually over the past two decades.
Shares Could Reach $141 or Higher: If we assume MasTec:
- maintains its TTM NOPAT margin of 6% (vs. five-year average of 5%) from 2021 through 2030, and
- grows revenue by 16% (equal to consensus revenue estimates) in 2021 and 2022, and
- grows revenue by 8% (half its pre-pandemic 10-year revenue CAGR) each year thereafter through 2030, then
the stock is worth $141/share today – 19% above the current price. See the math behind this reverse DCF scenario. In this scenario, MasTec’s NOPAT grows 10% compounded annually over the next decade.
As noted above, the firm grew NOPAT 12% compounded annually over the past decade, which includes a 23% year-over-year (YoY) decline in 2020 due to COVID-19 disruptions. Prior to 2020, MasTec grew NOPAT by 17% compounded annually from 2009-2019. Should MasTec grow profits closer to historical levels, the upside is even greater.
Figure 2: MasTec’s Historical and Implied NOPAT: DCF Valuation Scenarios
Sources: New Constructs, LLC and company filings
Allstate: Looks Cheap at Current Price With 128%+ Upside
We made Allstate a Long Idea in May 2020. Though the stock has underperformed, we still like its risk/reward.
What’s Working: Allstate’s TTM ROIC improved from 17% at the end of 1Q20 to 28% at the end of 1Q21. This improvement represents a continuation of a longer-term trend, in which ROIC has risen from just 8% in 2016.
Allstate is the second largest (by direct premiums written) home and auto insurer in the U.S. The firm’s acquisition of National General in 2H20 not only increases the firm’s market share, but it also gives Allstate access to another previously underutilized distribution channel, independent agents, which could be a driver of more revenue growth going forward.
The firm’s focus on technology to measure driver behavior and total miles driven provides the firm valuable data that allows it to better assess risk, lower costs, and offer more competitive rates. Allstate’s combined ratio[3], which measures the expenses and losses attributed to the firm’s underwriting business, continued its positive decline from 84.8 in 1Q20 to 83.2 in 1Q21.
The reduction in miles driven in 2020 helped reduce Allstate’s property and casualty insurance and claims expense by ~$2 billion YoY in 2020. Lower claim expense helped the firm’s NOPAT rise from $4 billion in 2019 to $7.8 billion TTM.
What’s Not Working: Total miles driven fell in 2020 during pandemic-driven shutdowns amid the shift to work from home (WFH). While these factors contributed to short-term profitability gains, over the long term, they will likely result in lower premiums. Likewise, the emergence of self-driving technology could further reduce accidents and lower premiums. However, self-driving vehicles are believed to be many years away. For reference, Morningstar estimates that level 5, fully automated driving, will not be available until 2030 provided safety and legal concerns are resolved.
Longer term, blockchain protocols have the potential to attract funding for more competitively priced insurance products that could pave the way for new low-cost providers to enter the market and threaten traditional home and auto insurers who fail to adapt.
Priced for Permanent Profit Decline: Allstate’s price-to-economic book value (PEBV) ratio is 0.3. This ratio implies that the market expects Allstate’s profits will permanently decline by 70%.
Below, we use our reverse DCF model to analyze the expectations for future growth in cash flows baked into Allstate’s current stock price.
In this scenario, we assume Allstate’s:
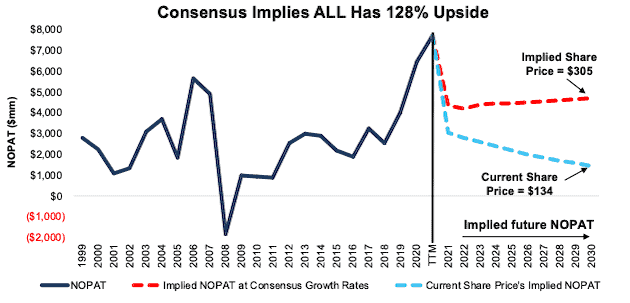
- NOPAT margin immediately falls to 7% (average since 1998 vs. 16% TTM) in 2021 through 2030, and
- revenue falls by 8% (vs. consensus estimate CAGR of +4% from 2021 to 2023) compounded annually through 2030
In this scenario, Allstate’s NOPAT falls by 14% compounded annually over the next decade and the stock is worth $134/share today – equal to the current price. See the math behind this reverse DCF scenario. For reference, Allstate grew NOPAT by 21% compounded annually over the past decade.
There’s 128%+ Upside: If we assume:
- Allstate’s NOPAT margin immediately falls to 9% (five-year average) in 2021 through 2030, and
- revenue grows by 4% compounded annually from 2021 to 2023 (equal to consensus estimate CAGR over same time) and
- revenue grows by 1% compounded annually from 2024-2030, which is below the average annual global GDP growth rate of 3.5% since 1961, then
the stock is worth $305/share today, or 128% above the current price. See the math behind this reverse DCF scenario.
In this scenario, Allstate’s NOPAT falls by 3% compounded annually over the next decade. This scenario includes conservative margin and revenue assumptions to illustrate just how negative the expectations for future cash flows are in Allstate’s current price. For reference, Allied Market Research expects the global home insurance market to grow 7% compounded annually from 2020 to 2027 and the global auto insurance market to grow ~9% compounded annually over the same time. If Allstate’s revenue grows in line with market expectations, the stock has even more upside.
Figure 3: Allstate’s Historical and Implied NOPAT: DCF Valuation Scenarios
Sources: New Constructs, LLC and company filings
Lear Corp Has 87%+ Upside
We made Lear Corp a Long Idea in July 2016 and reiterated it in February 2020. Here’s what we learned from 1Q21 earnings and why the stock still provides attractive risk/reward despite its underperformance.
What’s Working: Lear Corp grew revenue 20% YoY in 1Q21 and its TTM ROIC improved from a record low of 5.6% in 3Q20 to 7.5% in 1Q21.
Lear Corp is largely protected from the threats that the emerging EV market poses to many traditional auto suppliers. The firm’s two segments, seating and electrical distribution systems, are necessary in traditional, hybrid, and EV vehicles. Lear Corp is positioned to continue to leverage its longstanding relationships with incumbent OEMs as they successfully enter the EV market.
Additionally, the EV market provides Lear Corp with additional growth opportunities. The firm is developing several products exclusively for EVs such as terminals and connectors, high voltage battery management systems, and high efficiency battery chargers.
What’s Not Working: The firm formerly linked its executive compensation plan to its ROIC. However, in 2020, Lear Corp replaced its ROIC target with a total shareholder return goal, which means shareholders have no assurance that management’s interests are aligned with their own interests. Given that there is a strong correlation between improving ROIC and increasing shareholder value, we believe Lear Corp is mistaken to remove ROIC from its compensation plans.
The firm also has large customer concentration risk as 43% of Lear Corp’s 2020 revenue was attributed to just three customers, General Motors (GM), Ford (F), and Stellantis (STLA). A weakening relationship with any one of these firms could have a large impact on the firm’s financial performance.
The industry-wide semiconductor shortage led to large production disruptions at many major auto manufacturers, which negatively impacted Lear’s 1Q21 sales. Management estimates that the semiconductor shortage cost the firm $400 million in lost sales in 1Q21. This drag on Lear Corp’s top and bottom line is likely to persist so long as the chip shortage persists.
Current Price Has 87%+ Upside With Consensus Estimates: Below, we use our reverse DCF model to quantify the expectations for future growth in cash flows baked into LEA’s current price.
In this scenario, we assume:
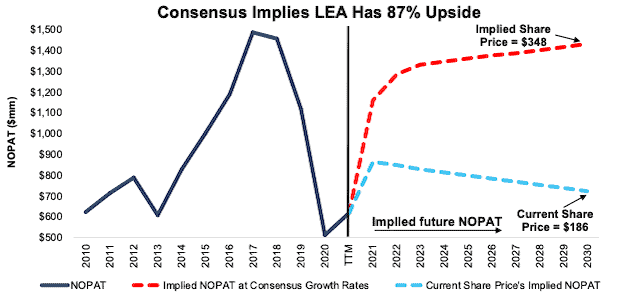
- Lear Corp’s NOPAT margin improves to 5% (which is the firm’s three-year average compared to 3% TTM) in 2021 through 2030 and
- revenue falls by 2% (vs. consensus estimate CAGR of 12% from 2021 to 2023) compounded annually from 2021 to 2030
In this scenario, Lear Corp’s NOPAT falls by 4% compounded annually from its pre-pandemic NOPAT levels in 2019 through 2030 and the stock is worth $186/share today – equal to the current price. See the math behind this reverse DCF scenario. For reference, Lear Corp grew NOPAT by 7% compounded annually from 2010 to 2019.
$348/Share If Consensus Is Right: If we assume:
- Lear Corp’s NOPAT margin improves to 6% (10-year pre-pandemic average) in 2021 through 2030
- revenue grows by 12% (equal to consensus estimates) compounded annually from 2021 to 2023, and
- revenue grows by 1% compounded annually each year thereafter through 2030, which is below the average annual global GDP growth rate of 3.5% since 1961, then
the stock is worth $348/share today, or 87% above the current price. See the math behind this reverse DCF scenario. In this scenario, Lear Corp’s revenue grows 4% compounded annually over the next decade and its NOPAT grows 11% compounded annually over the same time. For reference, Research And Markets expects the global motor vehicles market to grow by 9% compounded annually from 2020 to 2025. Lear Corp management expects to “grow sales at a greater rate than overall automotive industry production.” Should Lear Corp’s revenue grow in line with or greater than market projections, the stock has even more upside.
Figure 4: Lear Corp’s Historical and Implied NOPAT: DCF Valuation Scenarios
Sources: New Constructs, LLC and company filings
Other Long Ideas That We Still Love
Figure 5 shows four other Long Ideas that have recently reported calendar 1Q21 earnings along with their relative performance to the S&P 500.
Figure 5: More Long Ideas That Recently Reported Earnings: Through 5/11/2021
| Company | Ticker | Date Published | Earnings Date | Out (under)performance vs. S&P 500* |
| Simon Property Group | SPG | 4/20/20 | 5/10/21 | 81% |
| General Motors | GM | 7/15/20 | 5/5/21 | 79% |
| Hollyfrontier Corp | HFC | 7/8/21 | 5/5/21 | (7%) |
| Spirit AeroSystems Holdings | SPR | 4/7/21 | 5/5/21 | (13%) |
Sources: New Constructs, LLC
* Measured from the date of publication of each respective report. Performance represents price performance and is not adjusted for dividends.
This article originally published on May 12, 2021.
Disclosure: David Trainer owns SPG. Matt Shuler owns HFC. David Trainer, Kyle Guske II, and Matt Shuler receive no compensation to write about any specific stock, sector, style, or theme.
Follow us on Twitter, Facebook, LinkedIn, and StockTwits for real-time alerts on all our research.
[1] Our reports utilize our Core Earnings, a more reliable measure of profits, as demonstrated in Core Earnings: New Data & Evidence, a paper by professors at Harvard Business School (HBS) & MIT Sloan. Recently accepted by the Journal of Financial Economics, the paper proves that our data is superior to all the metrics offered elsewhere.
[2] Only Core Earnings enable investors to overcome the errors, omissions and biases in legacy fundamental research, as proven in Core Earnings: New Data & Evidence, forthcoming in The Journal of Financial Economics.
[3] Combined ratio = sum of incurred losses and expenses / earned premium


