
As Ben Hogan said:
“Golf is not a game of good shots. It’s a game of bad shots.”
Just one bad stock can ruin your portfolio, and that fact is precisely why doing proper diligence is so important.
Why Is Diligence Hard to Find?
Very few investors perform proper diligence. Here’s why:
- It requires lots of hard work, such as reading thousands of pages of financial filings, particularly the footnotes.
- It is not exciting. How often do your hear Jim Cramer say “Diligence, diligence, diligence” like he cheers ”buy, buy, buy”?
- It does not help sell more IPOs, especially the bad ones where bankers don’t want investors to know the truth about earnings. For example, Sweetgreen (SG), Rivian (RIVN), Gitlab (GTLB), Allbirds (BIRD), Peloton (PTON), and more.
Where To Get Diligence?
Start with Core Earnings[1] and the Bloomberg New Constructs Core Earnings Leaders Index (BCORET:IND). This index holds stocks where deep diligence reveals businesses that are more profitable than the market realizes, i.e. Core Earnings are higher than reported net income. It beat the S&P 500 by 9% (27% vs 18%) in 2025. More details on index construction are here.
Want to know which stocks earned Core Earnings Leaders status? Get “New Stocks That Passed the Core Earnings Leaders Test in 2Q2026.”
How To Avoid Bad Stocks?
Most importantly, the index avoids companies that are less profitable than the market realizes, i.e. Core Earnings are lower than reported net income.
Below we detail two companies that were recently dropped from the index because their Core Earnings no longer exceed reported net income.
The Boeing Company (BA): Overstated Earnings
Our Robo-Analyst AI parsed Boeing’s (BA: $224/share) 2025 10-K and found billions in non-operating income that artificially inflate GAAP earnings. As a result, Boeing’s 2025 Core Earnings are much lower than the company’s reported earnings.
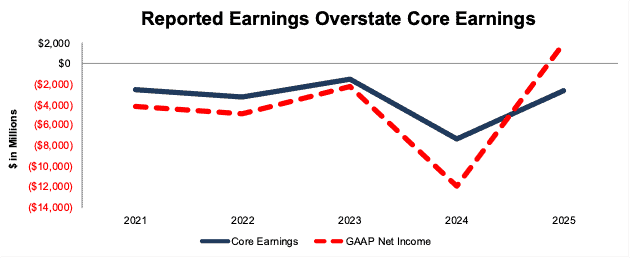
Boeing’s Core Earnings improved from -$7.4 billion in 2024 to -$2.6 billion in 2025. However, GAAP earnings improved much more, from -$11.9 billion to $1.9 billion, over the same time. Figure 1 shows the shift from -$4.5 billion in GAAP Earnings Distortion (Core Earnings > GAAP) in 2024 to $4.5 billion in GAAP Earnings Distortion (Core Earnings < GAAP) in 2025.
This multi-billion-dollar shift means Boeing is not as profitable as investors may think and is why it was removed from the Bloomberg New Constructs Core Earnings Leaders Index during the latest rebalance.
Figure 1: Boeing’s Core Earnings vs. GAAP Net Income: 2021 – 2025
Sources: New Constructs, LLC and company filings
How We Reconcile Boeing’s GAAP Earnings to Core Earnings
Below, we detail the hidden and reported unusual items that distort Boeing’s GAAP Earnings in 2025 as a real-world example of the work we do for all companies we cover. We remove all of these unusual income and expense items from Core Earnings.
We provide these details so readers can audit our research and see the importance of reading 10-Ks and 10-Qs.
Boeing’s GAAP Earnings Distortion Score is Strong Miss and the stock earns an Unattractive Stock Rating.
Boeing receives an Unattractive rating due to its negative economic earnings, return on invested capital (ROIC) of 0%, and expensive stock price.
Despite trading at $224/share, Boeing has an economic book value (EBV), or no-growth value, of -$53/share in large part because of its low ROIC and present value of total debt of $51.2 billion.
Boeing has a market-implied growth appreciation period (GAP) of greater than 100 years based on our Robo-Analyst’s default scenario in our reverse discounted cash flow (DCF) model.
Figure 2 details the differences, what we call GAAP Earnings Distortion, between Boeing’s 2025 Core Earnings and GAAP Earnings.
Figure 2: Boeing’s GAAP Earnings to Core Earnings Reconciliation: 2025

Sources: New Constructs, LLC and company filings.
Details on Key Data Found in the Footnotes
Boeing’s 2025 GAAP EPS are $2.48, and Core EPS are -$3.46. The difference is GAAP Earnings Distortion of $5.94/share, or $4.5 billion, and is comprised of the following:
Hidden Unusual Expenses Pre-Tax, Net = -$7.05/share, which equals -$5.4 billion and is comprised of:
- -$5.3 billion in 777x and 767 reach forward losses, abnormal production costs, and benefits from government assistance
- -$98 million in investment/asset impairment charges and acquisition related costs
Reported Unusual Income Pre-Tax, Net = $14.04/share, which equals $10.7 billion and is comprised of:
- $9.7 billion in gain on dispositions
- $1.2 billion in other income and income from operating investments
- -$120 million contra adjustment for recurring pension costs. These recurring expenses are reported in non-recurring line items, so we add them back and exclude them from Earnings Distortion
Tax Distortion = -$1.05/per share, which equals -$803 million
Given that the majority of GAAP Earnings Distortion listed above is reported, specifically the $9.7 billion gain on disposition, unknowing investors may assume Wall Street adjusts for these items accordingly.
However, Boeing receives 30 Buy, Overweight, or Hold ratings and just 1 sell rating on Wall Street.
Investors armed with Core Earnings have a more comprehensive set of unusual items to calculate a superior measure of profitability.
When we cut through the accounting noise, we see that Boeing is not as profitable as GAAP earnings show, which is why it no longer earns a place in the Bloomberg New Constructs Core Earnings Leaders Index.
Broadridge Financial Solutions (BR): Less Than Meets the Eye
A company can earn an Attractive-or-better rating and be removed from the Bloomberg New Constructs Core Earnings Leaders Index. Regardless of overall rating, if a company’s Core Earnings are lower than its GAAP Earnings, it doesn’t earn a spot in the index. Case in point: Broadridge Financial Solutions (BR: $161/share).
Broadridge Financial Solutions’ Core Earnings were greater than its GAAP earnings from fiscal 2022 to fiscal 2025. However, after we parsed the company’s fiscal 2Q26 10-Q, trailing-twelve-month GAAP earnings surpassed Core Earnings. As a result, Broadridge Financial Solutions was removed from the index in the latest rebalance, even as it earns an Attractive Stock Rating.
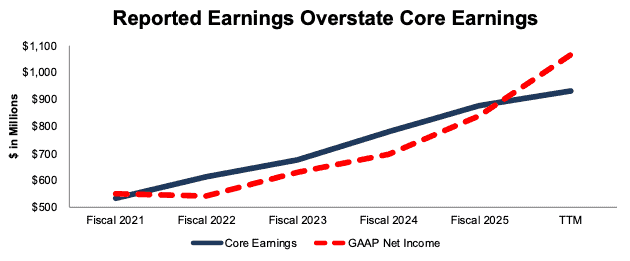
Broadridge Financial Solutions’ Core Earnings improved from $878 million in fiscal 2025 to $932 million in the TTM ended fiscal 2Q26. However, GAAP earnings improved much more, from $840 million to $1.1 billion, over the same time.
Figure 3 shows how Broadridge Financial Solutions’ GAAP Earnings Distortion increased from -$39 million (Core Earnings > GAAP) in fiscal 2025 to $135 million (Core Earnings < GAAP) in the TTM ended fiscal 2Q26.
Figure 3: Broadridge Financial Solutions’ Core Earnings vs. GAAP Net Income Since Fiscal 2021
Sources: New Constructs, LLC and company filings
How We Reconcile Broadridge’s GAAP Earnings to Core Earnings
Below, we detail the hidden and reported unusual items that distort Broadridge Financial Solutions’ GAAP Earnings in the TTM ended fiscal 2Q26.
Broadridge Financial Solutions’ GAAP Earnings Distortion Score is Strong Miss. The company’s GAAP Earnings Distortion of $135 million, or $1.14/share is 13% of reported earnings and 1.6% of total assets. In other words, Broadridge Financial Solutions’ GAAP earnings are overstated because they include $1.14/share of net unusual gains.
Figure 4 details the GAAP Earnings Distortion between Broadridge Financial Solutions’ TTM ended fiscal 2Q26 Core Earnings and GAAP Earnings.
Figure 4: Broadridge Financial GAAP Earnings to Core Earnings Reconciliation: TTM Fiscal 2Q26

Sources: New Constructs, LLC and company filings.
Details on Key Data Found in the Footnotes
Broadridge’s TTM ended 2Q26 GAAP EPS are $9.04, and Core EPS are $7.89. The difference is GAAP Earnings Distortion of $1.14/share, or $135 million, and is comprised of the following:
Hidden Unusual Expenses Pre-Tax, Net = -$0.43/share, which equals -$51 million and is comprised of:
- -$29 million in restructuring and other related costs and write down of long-lived asset and related charges
- -$23 million in acquisition and integration costs
Reported Unusual Income Pre-Tax, Net = $1.97/share, which equals $233 million and is comprised of:
- $233 million in other non-operating income primarily related to unrealized and realized gains on digital assets
Tax Distortion = -$0.40/per share, which equals -$47 million
Given that the majority of GAAP Earnings Distortion listed above is reported, unknowing investors may assume common earnings metrics adjust for these items.
However, without making these material adjustments, as we do to calculate Core Earnings, investors would not realize how overstated GAAP Earnings are.
The company’s GAAP Earnings grew 27% from fiscal 2025 to the TTM ended 2Q26. Meanwhile, Broadridge’s Core Earnings grew just 6% over the same time.
Just as with Boeing above, investors armed with Core Earnings insights get a more accurate picture of the real profitability of Broadridge. With this edge, we see that the company is not as profitable as its GAAP earnings indicate, which is why it was removed from the Bloomberg New Constructs Core Earnings Leaders Index.
As we noted in the opening of this report, just one bad stock can ruin your portfolio. Core Earnings, and the Bloomberg New Constructs Core Earnings Leaders Index, empower investors to quickly and easily avoid the stocks of companies that aren’t as profitable as reported results would have you believe.
Using Core Earnings to Pick Stocks Drives Alpha
You don’t have to take our word for it when we say picking stocks based on Core Earnings drives novel alpha.
The outperformance of the Bloomberg New Constructs Core Earnings Leaders Index provides real-time proof.
Per Figure 5, The Bloomberg New Constructs Core Earnings Leaders Index beat the S&P 500 by 9% in 2025. The Index (ticker: BCORET:IND) was up 27% while the S&P 500 was up 18%.
Figure 5: Bloomberg New Constructs Core Earnings Leaders Index Outperforms S&P 500 in 2025
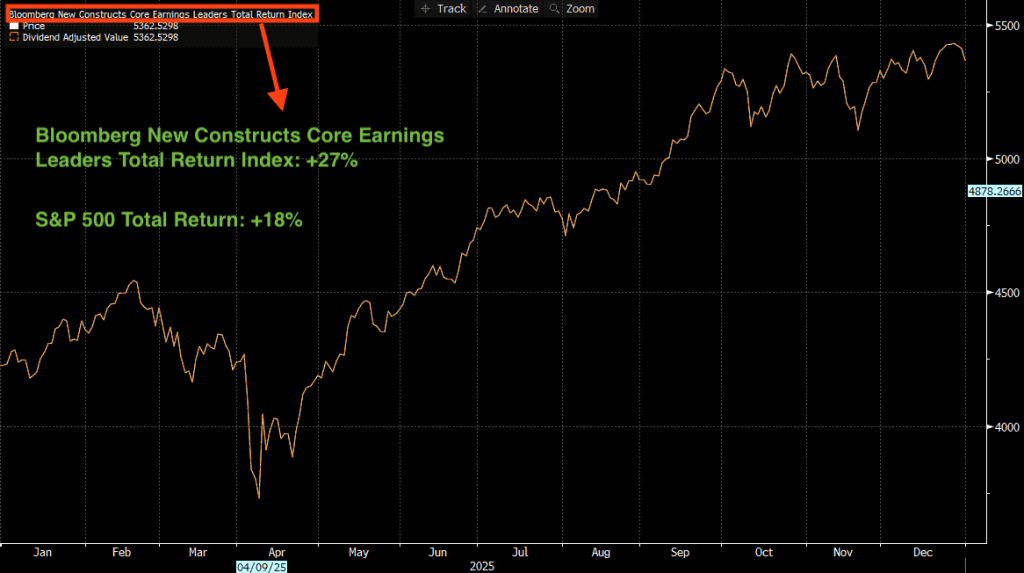
Sources: Bloomberg as of December 31, 2025
Note: Past performance is no guarantee of future results.
Per Figure 6, the Bloomberg New Constructs Core Earnings Leaders Index beat the S&P 500 by 24% over the past five years. The Index (ticker: BCORET:IND) was up 95% while the S&P 500 was up 71%.
Figure 6: Bloomberg New Constructs Core Earnings Leaders Index Outperforms S&P 500: Last 5 Years
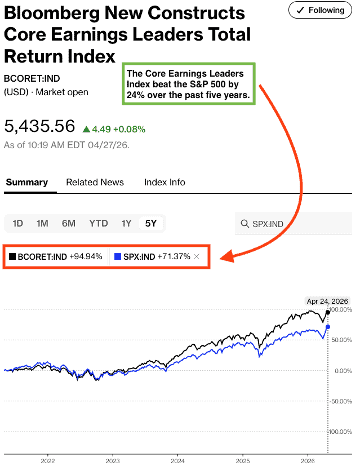
Sources: Bloomberg as of April 24, 2026
Note: Past performance is no guarantee of future results.
This article was originally published on May 7, 2026.
Disclosure: David Trainer and Kyle Guske II receive no compensation to write about any specific stock, style, or theme.
Questions on this report or others? Join our online community and connect with us directly.
[1] This paper from Harvard Business School and MIT Sloan professors empirically proves the idiosyncratic alpha in Core Earnings.