
Check out this week’s Danger Zone interview with Chuck Jaffe of Money Life.
As more investors fear a reversal of the huge market gains since mid-March, they should first eliminate extremely risky holdings from their portfolios. At the top of our list of extremely risky stocks investors should sell is Tesla (TSLA: $1,485/share), this week’s Danger Zone pick.
Since we put Tesla in the Danger Zone on July 29, 2019, the stock is up ~514% while the S&P 500 is up just 7%. While this performance makes TSLA more attractive to many momentum investors, more cautious investors see the unusually high level of risk in the stock given that fundamentals are not driving the soaring price.
This report helps investors of all types see just how extreme the risk in TSLA is based on:
- Overstated earnings from short-term regulatory credits
- Overlooked, but huge, EV market share that incumbent automakers will take
- Doing the math: investors do not realize the unrealistic production increases implied by the current valuation.
The Most Valuable Car Company in the World, or Most Overvalued?
In July 2020, Tesla became the most valuable car company in the world when it eclipsed the market cap of Toyota Motors (TM).
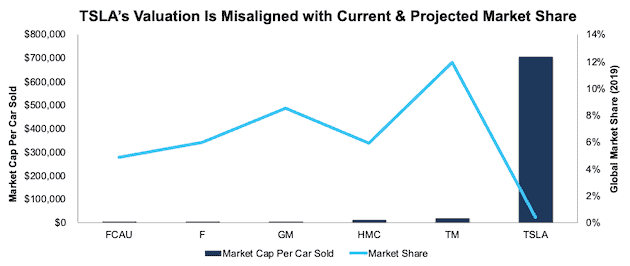
Figure 1 compares the market share and market caps per car sold for Tesla, Toyota, Honda Motors (HMC), General Motors (GM), Ford (F), and Fiat Chrysler (FCAU). Of the incumbent automakers, Toyota’s market cap per car sold is the highest at ~$18.1k. Tesla’s market cap per car sold over the TTM period is $704.2k, or more than 38 times higher than Toyota.
Is Tesla, with less than 1% of the global automotive market, worth that much more than Toyota, with ~12% of the market in 2019? Even if Tesla warrants this huge valuation premium now, how much upside is left from here?
Figure 1: Market Cap per Car Sold: Tesla vs. Peers – TTM
Sources: New Constructs, LLC, and company filings
Tesla Turns a Profit Selling Regulatory Credits, Not Vehicles
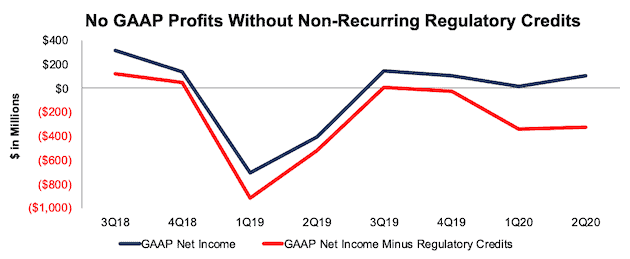
Tesla’s recently reported profits are based on sales of free regulatory credits to gasoline automakers, whose fleets, on average, don’t meet regulatory required emissions levels.
Tesla enjoys a 100% profit margin on these credits since the company gets them as a free byproduct of being an all-electric vehicle maker. In 2Q20 alone, Tesla sold $428 million in regulatory credits on its way to reporting GAAP net income of $104 million. When we remove these credits, Tesla’s GAAP net income would have been negative in each of the past three quarters, per Figure 2.
Figure 2: GAAP Profits with and Without Regulatory Credits: 3Q18 – 2Q20
Sources: New Constructs, LLC, and company filings
Selling credits isn’t a viable long-term strategy. As other firms ramp up production of EVs and earn more credits, they purchase less from Tesla. For example, The Financial Times reported that Fiat Chrysler reached a deal to buy 1.8 billion euros worth of credits from Tesla to avoid large fines in the U.S. and Europe in 2020 and 2021. However, Fiat Chrysler CEO Mike Manley noted in the firm’s 1Q19 earnings call that it expects to be compliant without the help of credits from Tesla by 2022. Without the profits from selling free regulatory credits, Tesla will have trouble increasing its already overstated profits.
Market Share Will Drop Precipitously as Incumbents Enter the EV Market
Tesla bulls tend to overlook the slow, but deliberate and large, entrance that incumbent automakers will make in the EV market. By 2025, these firms are expected to sell ~3.1 million EVs, which is significantly more than even the most optimistic estimates for Tesla sales in 2025.
- Volkswagen plans to produce 1.5 million EVs in 2025.
- General Motors plans to sell 1 million EVs by 2025. The firm aims to spend $20 billion on EVs through 2025 and roll out at least 20 different EV models by 2023.
- Toyota plans to produce 500,000 EVs by 2025. Further, it expects to generate half its global sales (which at 2019 levels would be ~5.3 million vehicles) from electrified vehicles (which includes hybrids) in 2025.
- Ford is expected to sell ~332,000 EVs in 2025. The firm is investing $11 billion through 2022 to develop 40 new fully-electric and hybrid vehicles.
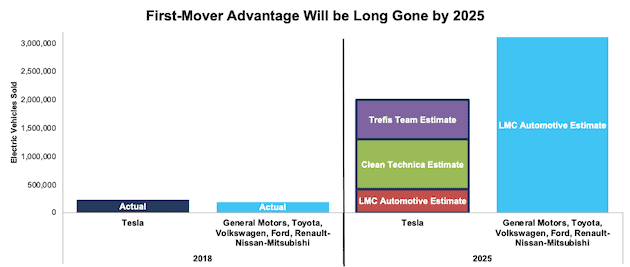
Figure 3 illustrates how the incumbent automakers will dominate, relative to Tesla, the EV market by 2025. Projections for Tesla’s vehicle sales in 2025 vary widely: 2 million from the Trefis Team, 1.3 million from Clean Technica, and 413,000 from LMC Automotive. We have not found an estimate for Tesla sales that is not well below the incumbents expected EV sales of ~3.1 million EVs in 2025.
Both Volkswagen and Renault-Nissan-Mitsubishi are expected to sell more cars than Tesla by 2025.
Figure 3: Past & Projected Electric Vehicle Sales by Manufacturer: 2018 & 2025
Sources: New Constructs, LLC, and LMC Automotive, Clean Technica and Trefis Team
Incumbents Make Better & Cheaper Cars and Their Market Share Gains Will Persist
Investors should note the operational competitive advantages of the incumbent automakers. Specifically, they enjoy superior manufacturing, distribution and marketing scale advantages over Tesla. Those advantages mean they can produce better vehicles at a lower cost as well as distribute and sell vehicles with more scale and efficiency. As we approach 2025, the cash flow benefits of those competitive advantages will be on full display.
Meanwhile, as Tesla struggles to scale up production, vehicle quality complaints have scaled up, too. J.D. Power first noted issues with the quality of Tesla’s vehicles in 2017. In the 2020 J.D. Power Initial Quality Survey, Tesla vehicles, in their first year included in the study, would[1] have ranked last among major automakers. The vehicles were found to have 250 problems per 100 vehicles, much higher than the industry average of 166 problems.
Dodge, owned by Fiat Chrysler, tied with Kia for first with an initial quality score of 136, and Chevrolet, owned by General Motors, ranked just behind the two with a score of 141. Hyundai, General Motors, BMW, Ford, Nissan, and Toyota respectively earned the most vehicle model level awards. General Motors’ Yantai Dongyue 2 plant received the Platinum Quality Award for producing vehicles with the fewest defects or malfunctions.
Is there a bigger competitive advantage in the auto business than the ability to produce higher quality cars at scale? Maybe, marketing can offset some of that advantage, and Elon Musk is an excellent marketer. Nevertheless, we think the incumbents will reveal that Tesla is just a flashy boutique automaker that cannot compete with them in the long run, which begins in 2025.
Unable to Keep Up with Incumbent Spending on the EV Market
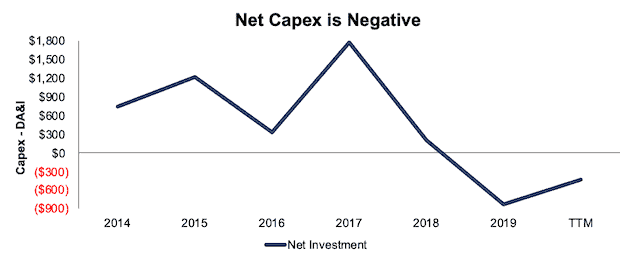
After investing heavily in its operations for years, Tesla has reversed course, presumably to meet profit goals and reduce dependence on outside capital. Tesla’s capex in 2019 ($1.3 billion) represented just 62% of its depreciation, amortization, and impairment ($2.2 billion). In other words, net investment was -$827 million.
Over the TTM period, depreciation, amortization, and impairment remains higher than capex and net investment is -$429 million, per Figure 4.
Tesla is ramping down spending as competitors are ramping up.
Figure 4: Tesla Capex Minus Depreciation, Amortization, and Impairment: 2014-TTM
Sources: New Constructs, LLC, and company filings
Even if Tesla maintained its capex investing at historical levels, it would still be just a small fraction of the incumbent automakers’ spending on EV over the next few years. For example:
- Volkswagen Group plans to spend 33 billion euros (~$39 billion at current exchange rates) through 2024.
- General Motors plans to spend $20 billion through 2025.
- Daimler (Mercedes Benz) plans to spend 10 billion euros (~$11.8 billion at current exchange rates) through 2022.
- Ford plans to spend $11 billion through 2022.
- Total for these four alone: $82 billion
Consulting firm AlixPartners puts the overall incumbent investment in EV even higher at $255 billion by 2022.
Tesla’s capex over the TTM period was just $1.8 billion and plans for future spending remain unclear.
In the firm’s 4Q19 earnings call, when asked about guidance for capex in 2020, CEO Elon Musk said “I don't know if we wanted to tell you, I don't think we want to say what our capex is going to be this year”.
Tesla must find a way to fund numerous capital intensive projects to have any hope of growing production capacity and preserving its EV market share:
- Building the Berlin Gigafactory
- Build capacity for Model Y at the Shanghai Gigafactory
- Building the next US Gigafactory in Austin, Texas
- Increase production of Model 3 and Y in its Fremont plant
- Develop and built the Tesla Semi, Cybertruck and Roadster
Perhaps, Tesla’s lack of real profits becomes a real problem as the company’s ability to sell stock at such high prices diminishes and the firm cannot get the capital needed to grow its business.
Not the Only (or Even the Best) Self-Driving Tech in Town
Tesla has boasted about its vehicle’s self-driving capabilities for a long time, even going as far as selling an “Autopilot” feature for $2,000-$3,000 and a “Full Self Driving” feature for $7,000. The names of these features are misleading.
Tesla’s misleading marketing of these features has run into trouble with regulators, with a German court banning the use of “full potential for autonomous driving” and “Autopilot inclusive” from German marketing materials. In the United States, the National Transportation Safety Board (NTSB) criticized Tesla for not taking adequate steps to prevent “foreseeable abuse” of its Autopilot technology.
Furthermore, the Los Angeles Times reports that the NTSB provided recommendations in 2017 for driver-assist systems to prevent driver inattention and misuse. Automakers including Volkswagen, Nissan, and BMW reported on their attempts to meet the recommendations, but Tesla did not. On this topic, NTSB Chairman Robert Sumwalt remarked: “Sadly, one manufacturer has ignored us, and that manufacturer is Tesla. We’ve heard nothing; we’re still waiting.”
Meanwhile, Tesla is not the only firm with self-driving auto aspirations. Audi, BMW, Daimler, Volvo, Ford, General Motors, Honda, and Toyota each have their own driver assist and self-driving platforms. Other automakers, such as Jaguar Land Rover, Nissan, and Renault are partnering with Waymo (owned by Alphabet (GOOGL) to assist in their self-driving capabilities.
Importantly, Tesla lags some of the incumbent manufacturers and those partnering with traditional automobile firms. For instance, Consumer Reports ranked General Motors’ Super Cruise ahead of Tesla’s Autopilot system. MES Insights, an industry research provider, ranks Waymo, GM Cruise, and Ford’s Argo AI startup ahead of Tesla in terms of expertise and capabilities for self-driving. Lastly, Guidehouse Insights ranked Waymo, Ford and General Motors first, second, and third respectively in their Automated Driving Vehicles leaderboard. Tesla ranked last out of the 18 firms included in the analysis.
Doing the Math: Reverse DCF Analysis to Quantify the Overvaluation of Tesla
We’ve outlined the competitive forces that will challenge Tesla, and, now, we will illustrate just how overvalued the stock is in the face of these forces.
We also want to take a moment to recognize that the performance of this stock has rarely, if ever, been about valuation and that it has earned tremendous returns for many, many investors. Nevertheless, we think the time has come for those with fiduciary responsibilities to consider just how much risk they take by owning TSLA at anywhere close to current levels.
At its current price of ~$1,500, Tesla is priced as if it will not only achieve the scale and production of a mass-market automaker and capture a majority of the electric vehicle market, but also do so while maintaining its already high prices. Below, we use our reverse DCF model to quantify the cash flow expectations baked into Tesla’s current stock price.
Already Priced for Perfection:
To justify its current price of ~$1,500/share, Tesla must:
- Immediately achieve a 7% NOPAT margin, which is equal to Toyota’s NOPAT margin (7%), and above Tesla’s TTM NOPAT margin of 5.6%.
- Grow revenue by 30% compounded annually for the next 11 years, which given the margin improvement, means NOPAT grows 48% compounded annually over the same time.
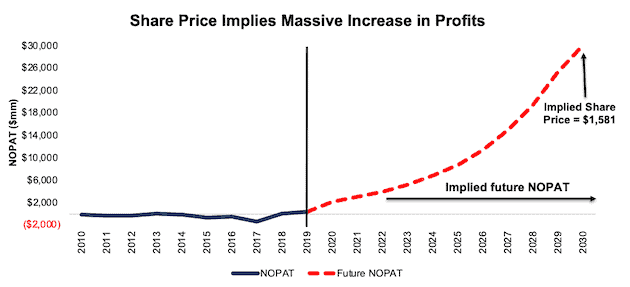
See the math behind this reverse DCF scenario. In this scenario, Tesla would earn $438 billion in revenue 11 years from now, (which would equal 55% of 2027’s projected EV revenues). In this scenario, Tesla’s NOPAT in 2030 equals $30.1 billion (vs. $1.5 billion TTM). For comparison, Toyota, the world’s second largest (by revenue) automobile manufacturer, generated TTM NOPAT of $19.4 billion. Over the TTM period, only five companies generated NOPAT greater than the NOPAT implied by Tesla’s valuation: Apple (AAPL) at $54.5 billion, Microsoft (MSFT) at $44.8 billion, JPMorgan Chase (JPM) at $34.7 billion, Alphabet (GOOGL) at $32.3 billion and Bank of America (BAC) at $30.2 billion.
Figure 5 compares the firm’s implied future NOPAT in this scenario to its historical NOPAT. In any scenario worse than this one, TSLA holds significant downside risk, as we’ll show.
Figure 5: Current Valuation Implies Drastic Profit Growth
Sources: New Constructs, LLC and company filings.
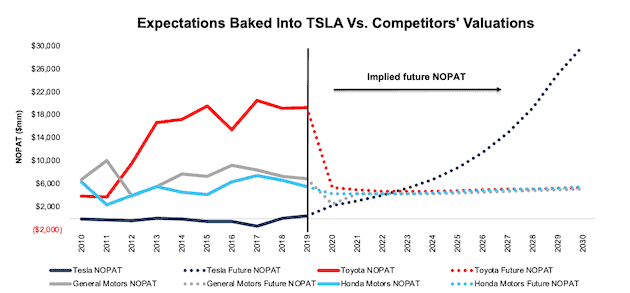
Figure 6 illustrates the expectations baked into Tesla’s stock price compared to the expectations baked into the next three largest auto manufacturers by market cap: Toyota, Honda Motors, and General Motors. As you can see, the market currently prices the three incumbents as if profits will severely and permanently drop, while Tesla’s profits will soar.
Figure 6: Current Valuation Implies Tesla Profits Soar and Competitors Fall
Sources: New Constructs, LLC and company filings.
No One Expects the Production Increases Implied by Tesla’s Stock Price
Based on the average sales price (ASP) of Tesla’s vehicles, we also calculate the number of vehicles the firm must sell to generate the revenue implied by the scenario above. Per Figure 7, at its current ASP of $56.7k, the firm will sell 7.7 million vehicles, or 30% of the entire EV market, in 2030.
Are there any investors who believe Tesla will be able to produce 7.7 million vehicles by 2030? That’s 1447%[2] more than expected sales in 2020.
Even if Tesla meets the most optimistic estimate and sells 2 million vehicles by 2025, can it make another quantum leap in production from 2 million to 7.7 million in 2030?
Morgan Stanley analyst Adam Jonas projects Tesla will sell 3 million units a year by 2030, or less than half the sales volume implied by its valuation.
If Tesla’s ASP falls to ~$37,000, or the average car price in the U.S. in 2019, its implied sales volume in 2030 increases to 11.9 million vehicles in 2030, or 45% of projected EV sales in that year.
Figure 7: Current Valuation Implies Significant Increase in Number of Vehicles Sold
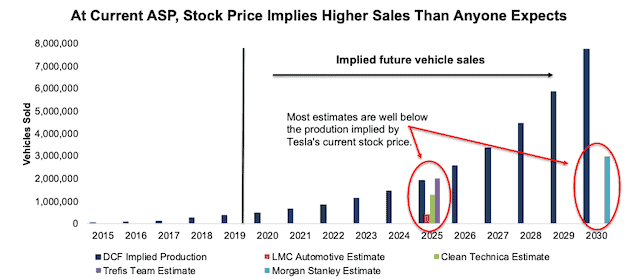
Sources: New Constructs, LLC, company filings, LMC Automotive, Clean Technica, Trefis Team & Morgan Stanley.
Valuation of Incumbents Implies Production Declines
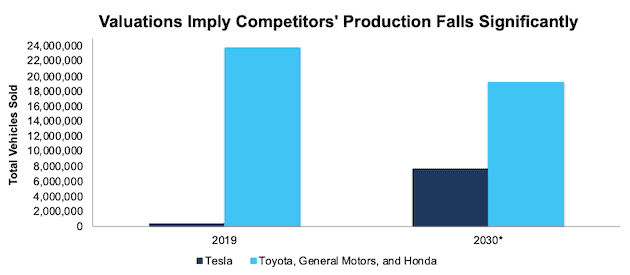
The incumbents’ stock prices imply their vehicle production (measured from 2019 levels) will have declined by 19% in 2030, while Tesla’s increases by 2005% over the same time frame. See Figure 8 for an illustration. Note: these are the projections baked into current stock prices. For investors to own or buy TSLA at current levels means, from a fundamental perspective, they must believe the firm will outperform the current projections.
Figure 8: Implied Production Increase for TSLA Is Unrealistic
Sources: New Constructs, LLC and company filings.
*2030 production levels based on implied revenue from DCF scenarios in Figure 6 and the average selling price of each manufacturer’s vehicles in 2019.
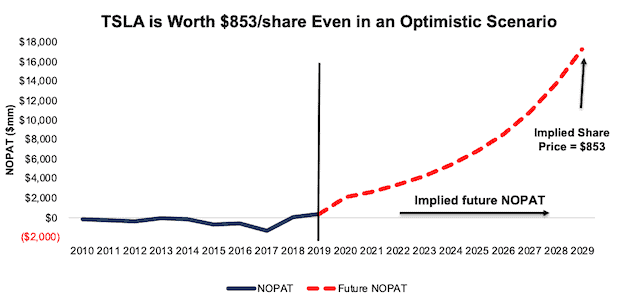
Significant Downside Even in an Optimistic Scenario
Even if we assume Tesla can achieve a 7% NOPAT margin, equal to Toyota, and grow revenue by 26% compounded annually (in line with consensus estimates through 2025) for the next decade, the stock is worth only $853/share today – a 43% downside to the current stock price. See the math behind this reverse DCF scenario.
Figure 9 compares the firm’s implied future NOPAT in this scenario to its historical NOPAT. This scenario implies Tesla’s NOPAT 10 years from now will be over $17 billion. For reference, Toyota’s TTM NOPAT is just 13% higher, at $19 billion.
Figure 9: Tesla Has Large Downside Risk: DCF Valuation Scenario
Sources: New Constructs, LLC and company filings.
Even More Downside in A More Likely Scenario
We think it is likely that Tesla never generates more than $5 billion in NOPAT, which gives it a fundamental value ~$180/share. Our most likely scenario is that investors wake up to Tesla’s competitive disadvantages and knock the stock down to $250-300/share where a white knight buyer might scoop it up.
S&P 500 Inclusion May Not Be the Boon Some Expect
The big development at the end of 2Q20 was that, due to its fourth consecutive quarter of GAAP net income, Tesla would now be eligible for inclusion in the S&P 500. Many believe inclusion would cause billions in capital to flow into TSLA, as fund managers and ETFs that index to the S&P 500 would be forced to buy shares of Tesla.
However, the effects of index inclusion may be short-lived, and not nearly as meaningful as some investors expect. A new working paper from professors at Ohio State University, Tulane University, and Lancaster University, “Does Joining the S&P 500 Index Hurt Firms?” investigates the impact of firms of joining the S&P 500 index from 1997 to 2017.
Most importantly on the topic of Tesla’s inclusion, the paper makes two key findings. First, joining the index has a transitory positive effect but no long-term effect on stock prices in the first half of the sample period (1997-2007). Second, stock prices of firms joining the index experience no transitory positive effect and negative risk-adjusted long-term return in the second half of the sample period (2008-2017). In other words, the effect of being added to the S&P 500 is negative in recent years.
Catalyst: Market Can Remain Irrational, But These Events Could Send Shares Lower
While Tesla reported four consecutive quarters of GAAP profits, it’s clear from our analysis that these profits aren’t sustainable.
The regulatory credits not only mislead investors about Tesla’s profitability, but they also teach investors to focus on GAAP profits, which could set the firm up to miss expectations in the coming quarters. Unlike many other firms, consensus expectations for Tesla have not fallen as precipitously due to the COVID-19 pandemic. In fact, expectations for 2020 EPS currently sit at $4.37/share. Meanwhile, expectations for 2021 are nearly three times as high, at $12.92/share. If Tesla fails to meet or beat these soaring expectations, shares could fall significantly to a more rational level.
Further, our market share analysis shows that the music will stop for Tesla at some point in the next few years. With the current stock valuation implying greater market share than Tesla or even its bullish analysts predict, it is only a matter of time before analysts and investors will have to reconcile their unrealistic hopes with reality.
What Noise Traders Miss With TSLA
These days, fewer investors pay attention to fundamentals and the red flags buried in financial filings. Instead, due to the proliferation of noise traders, the focus tends toward technical trading tends while high-quality fundamental research is overlooked. Here’s a quick summary for noise traders when analyzing TSLA:
- Reported GAAP profits are a mirage driven by non-recurring regulatory credit sales
- Competition is projected to ramp up production and surpass Tesla in just a few years
- Declining net investment and lack of access to capital undermines Tesla’s growth potential
- Valuation implies Tesla can supplant nearly all incumbent automakers and garner over half the projected 2027 EV market revenues
Executive Compensation Adds Additional Risk
Tesla made headlines in early 2018 with a new compensation plan for Elon Musk that the New York Times described as the “Boldest Pay Plan in Corporate History.” Bold is one way to describe the plan, which provides for 12 escalating tranches of stock option grants based on hitting market cap, revenue, and adjusted EBITDA levels. We would call it foolhardy.
In many ways, Musk’s compensation plan reminds us of the misaligned incentives that led to the blowup of Valeant (VRX). Like Valeant’s plan, Tesla’s compensation plan uses adjusted, “Non-GAAP” measures and outrageous valuation targets that incentivize excessive risk-taking with no accountability to the true fundamentals of the business. Tesla’s compensation plan could encourage value-destroying acquisitions, shareholder dilution, earnings management, and a focus on keeping the stock price higher, rather than building a long-term profitable business.
Without significant changes to its executive compensation, Elon Musk is incentivized to boost top-line growth numbers with no attention to prudent capital stewardship. We’d recommend the firm’s compensation committee tie pay to improving ROIC, which is directly correlated with creating shareholder value.
Insider Trading and Short Interest
Insider activity has been minimal over the past 12 months, with 15 thousand shares purchased and 253 thousand shares sold for a net effect of 238 thousand shares sold. These sales represent less than 1% of shares outstanding.
There are currently 12.7 million shares sold short, which equates to 7% of shares outstanding and less than 1 day to cover. The number of shares sold short has declined by 9% since last month.
Critical Details Found in Financial Filings by Our Robo-Analyst Technology
As investors focus more on fundamental research, research automation technology is needed to analyze all the critical financial details in financial filings as shown in the Harvard Business School and MIT Sloan paper, "Core Earnings: New Data and Evidence”.
Below are specifics on the adjustments we make based on Robo-Analyst findings in Tesla’s 10-Q and 10-K:
Income Statement: we made $1.5 billion of adjustments, with a net effect of removing $1.3 billion in non-operating expenses (5% of revenue). You can see all the adjustments made to Tesla’s income statement here.
Balance Sheet: we made $9.7 billion of adjustments to calculate invested capital with a net decrease of $412 million. One of the most notable adjustments was $1.2 billion in asset write-downs. This adjustment represented 5% of reported net assets. You can see all the adjustments made to Tesla’s balance sheet here.
Valuation: we made $54.1 billion of adjustments with a net effect of decreasing shareholder value by $39.5 billion. The most notable adjustment to shareholder value was $29.7 billion in outstanding employee stock options. This adjustment represents 11% of Tesla’s market cap. See all adjustments to Tesla’s valuation here.
Unattractive Funds That Hold TSLA
The following funds receive our Unattractive-or-worse rating and allocate significantly to Tesla.
- Baron Partners Fund (BPTIX) – 31.3% allocation and Unattractive rating
- Baron Focused Growth Fund (GFGUX) – 25.3% allocation and Unattractive rating
- ARK Autonomous Technology & Robotics ETF (ARKQ) – 13.3% allocation and Unattractive rating
- ARK Innovation ETF (ARKK) – 10.8% allocation and Very Unattractive rating
- VanEck Vectors Low Carbon Energy ETF (SMOG) – 9.6% allocation and Unattractive rating
- American Beacon ARK Transformational Innovation Fund (ADNIX) – 9.5% allocation and Very Unattractive rating
This article originally published on August 4, 2020.
Disclosure: David Trainer, Kyle Guske II, and Matt Shuler receive no compensation to write about any specific stock, sector, style, or theme.
Follow us on Twitter, Facebook, LinkedIn, and StockTwits for real-time alerts on all our research.
[1] Tesla isn’t officially included in JD Power’s rankings, because according to Doug Betts, president of the automotive division at J.D. Power, “unlike other manufacturers, Tesla doesn’t grant us permission to survey its owners in 15 states where it is required. However, we were able to collect a large enough sample of surveys from owners in the other 35 states and, from that base, we calculated Tesla’s score.”
[2] Note that Tesla’s stated goal for sales in 2020 is 500,000 vehicles.