
We published an update on this Danger Zone pick on September 9, 2022. A copy of the associated report is here.
With the return of Quantitative Tightening, access to cheap capital has disappeared for all but the highest-quality companies. Unless the Fed changes course, this company must either dramatically cut costs and lower its cash burn, or it will go bankrupt.
Snap Inc. (SNAP: $10/share), is our newest addition to the zombie stock list because of its high risk of going to $0/share. We’ve featured other zombie stocks Carvana (CVNA) here, Freshpet (FRPT) here, and Peloton (PTON) here.
Zombie Companies with Little Cash Are Risky
Companies with heavy cash burn and little cash on hand are risky in any market, but especially now. Being forced to raise capital in this environment, even if the company ultimately becomes profitable, comes at a high cost that is not good for existing shareholders. As cash-burning “zombie companies” run out of cash, risk premiums will rise across the market, which could further squeeze liquidity and create an escalating series of corporate defaults.
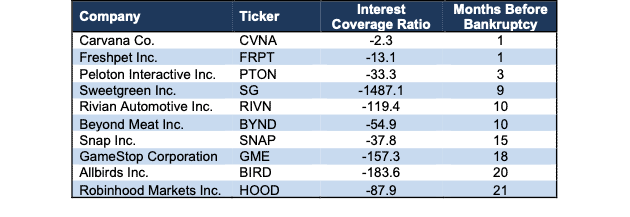
Figure 1 shows the zombie companies most likely to run out of cash first, based on free cash flow (FCF)[1] burn and cash on the balance sheet over the trailing-twelve-months (TTM). Each company in Figure 1 has:
- negative interest coverage ratio (EBIT/Interest expense)
- negative FCF over the TTM
- less than 24 months before it needs more capital to subsidize the TTM FCF burn rate
- been a Danger Zone pick
Figure 1: Danger Zone Stocks with Less than Two Years’ Worth of Cash on Hand: TTM
Sources: New Constructs, LLC and company filings.
To calculate “Months Before Bankruptcy” we divided the TTM FCF burn, excluding acquisitions, by 12, which equals monthly cash burn. We then divide Cash and Equivalents on the balance sheet as of the most recent 10-Q or 10-K by monthly cash burn.
Not surprisingly, the companies that are most at risk of seeing their stock prices go to $0 are the ones with a poor underlying business model, which was overlooked by investors during the 2020-2021 meme stock frenzy. Companies such as Carvana, Freshpet, and Peloton have less than six months of cash on their balance sheets based on their FCF burn over the past twelve months. Snap isn’t far behind.
And Overvalued Zombie Stocks Are the Riskiest
Stock valuations that embed high expectations for long-term profit growth add more risk to owning shares of zombie companies facing short-term distress. With these stocks, overvaluation risk is stacked on top of short-term cash flow risk.
Below, we’ll take a closer look at Snap and detail the company’s cash burn and how much further its stock price could fall.
Snap Inc. (SNAP: $10/share)
We put Snap (SNAP) in the Danger Zone in September 2020 and the stock has outperformed the S&P 500 as a short by 76% since then. Even after falling 88% from its 52-week high, 79% YTD, and 87% from our most recent report in August 2021, we think the stock has much more downside. Our prior reports on Snap are here.
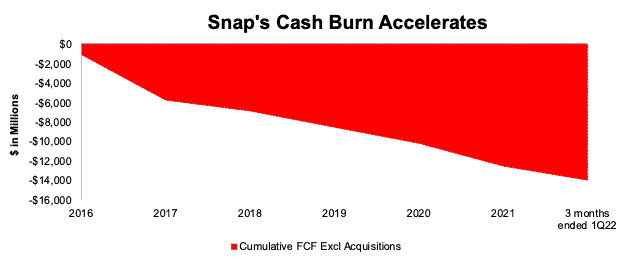
Snap has failed to generate positive free cash flow in any period since going public in 2017. Since 2016 (earliest available FCF data), Snap has burned through $13.9 billion in FCF, per Figure 2.
The cash bonfire at Snap shows no signs of abating as the company burned through $3.9 billion in FCF over the TTM ended 1Q22. With just $4.9 billion in cash and cash equivalents on the balance sheet at the end of 2Q22, Snap’s cash balance could only sustain its cash burn for just over one year after 2Q22.
The short lifeline of cash includes the $1.3 billion in convertible senior notes Snap issued in February 2022. Raising additional capital to fund further cash burn would likely come at an even higher cost and be bad news for investors.
Figure 2: Snap’s Cumulative Free Cash Flow Since 2016
Sources: New Constructs, LLC and company filings.
User Growth Continues Long-Term Slowdown
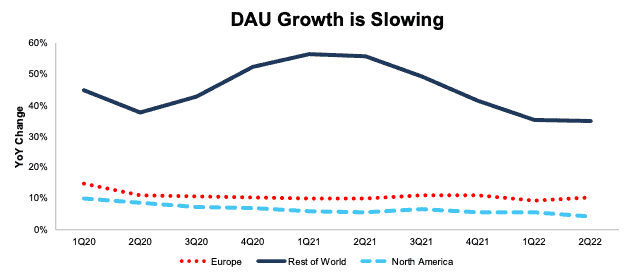
Snap’s year-over-year user growth has consistently slowed in recent quarters, much as we’ve seen with other companies single-mindedly focused on user growth, such as Netflix (NFLX) and Pinterest (PINS). Each of Snap’s geographic regions has experienced a slowdown in user growth. In 2Q20, DAUs grew 8%, 11%, and 38% in North America, Europe and the Rest of the World year-over-year (YoY), respectively. In 2Q21, DAUs grew 6%, 10% and 56% YoY respectively. Now, in 2Q22, DAUs grew just 4%, 10%, and 35% YoY in each of those same regions. See Figure 3.
Figure 3: Snap’s DAU Growth by Region Since 1Q20
Sources: New Constructs, LLC and company filings.
Snap is also seeing a slowdown in its average revenue per user (ARPU) after seeing ARPU soar in 2021.In 2Q21, ARPU grew 117%, 77%, and 20% in North America, Europe and the Rest of the World YoY respectively. In 2Q22, ARPU growth dropped to 8%, 2% and -11% YoY in each of those same regions.
Current Price Implies Snap Rivals Facebook’s DAUs
We use our reverse discounted cash flow (DCF) model to analyze the future cash flow expectations baked into Snap’s current valuation. Despite fierce competition and negative profit margins, and management declining to provide guidance for 3Q22, Snap’s stock is priced as if the business will significantly improve profitability while growing its user base to near Facebook levels, a feat that is highly unlikely to materialize.
To justify its current price of $10/share, our model shows that Snap would have to:
- immediately improve NOPAT margin to 10% (average between Twitter and Pinterest’s TTM NOPAT margin, compared to Snap’s -15% TTM margin) and
- grow revenue at a 24% CAGR through 2028 (nearly 1.5x projected industry growth).
In this scenario, Snap would generate nearly $19 billion in revenue in 2028, which is 4x its TTM revenue. At its current annual ARPU[2], $13.92 at the end of 2Q22, this scenario implies the firm would have 1.3 billion DAUs, or just 31% fewer than Facebook’s DAUs at the end of 1Q22.
We think it is overly optimistic to assume Snap will achieve margins anywhere near 10%, especially given its user growth largely comes from its lower ARPU “Rest of World” segment, while also growing DAUs to 1.3 billion. Perhaps, bulls could argue that Snap might be able to raise margins or DAUs to such high levels, but suggesting the firm could do both at the same time strains credibility.
50% Downside If Snap Grows at Industry Rates
Snap has an economic book value, or no growth value, of -$9/share, which highlights just how expensive shares are.
Below, we review an additional optimistic DCF scenario to highlight the downside risk, even if Snap’s revenue grows at the same pace as digital advertising industry and margins rise to Twitter’s three-year high.
If we assume Snap’s:
- NOPAT margin improves to 8% (equal to Twitter’s 2019 margin),
- revenue grows at consensus rates in 2022, 2023, and 2024, and
- revenue grows 17% each year from 2025-2028 (equal to industry growth) then
the stock would be worth just $5/share today – a 50% downside to the current price. At Snap’s current ARPU, this scenario implies Snap has 1.1 billion DAUs in 2028. Even if we assume Snap can double its ARPU, this scenario implies it has 570 million DAUs, or 164% of its TTM DAUs. If Snap’s growth falters, as it’s North America and Europe DAU growth slows, or it fails to improve margins as quickly as estimated in this scenario, the downside risk in the stock is even higher.
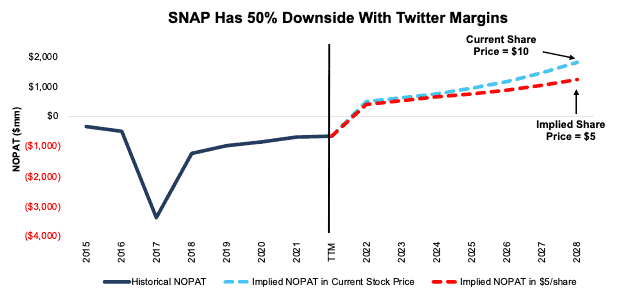
Figure 4 compares the firm’s historical NOPAT and implied NOPATs for the two scenarios we presented to illustrate just how high the expectations baked into Snap’s stock price remain.
Figure 4: Snap’s Historical and Implied NOPAT: DCF Valuation Scenarios
Sources: New Constructs, LLC and company filings
Each of the above scenarios assumes Snap’s YoY change in invested capital is 10% of revenue in each year of our DCF model. For context, Snap’s invested capital has grown 36% compounded annually since 2015 and change in invested capital averaged 48% of revenue from 2019-2021 and 87% of revenue over the TTM.
This article originally published on July 22, 2022.
Disclosure: David Trainer, Kyle Guske II, Matt Shuler, and Brian Pellegrini receive no compensation to write about any specific stock, style, or theme.
Follow us on Twitter, Facebook, LinkedIn, and StockTwits for real-time alerts on all our research.
[1] We exclude the impact of acquisitions to free cash flow in our analysis throughout this report.
[2] Calculated as TTM revenue of $4.5 billion divided by average quarterly DAUs over the TTM (326 million).