
We published an update on SHOP on March 7, 2022. A copy of the associated update report is here.
We’re reiterating three Danger Zone picks that recently reported calendar 2Q21 earnings. Despite top line beats, these businesses remain remarkably far behind where their stock valuations imply they should be. Tesla (TSLA: $645/share), Snap Inc, (SNAP: $75/share) and Shopify (SHOP: $1,550/share) are in the Danger Zone.
We leverage more reliable fundamental data, proven in The Journal of Financial Economics[1], with qualitative research to highlight these firms whose stocks present poor risk/reward.
Figure 1: Danger Zone Performance: Through 7/30/21
Sources: New Constructs, LLC
Performance represents price performance and is not adjusted for dividends.
*Measured from our most recent Tesla Danger Zone report on January 11, 2021.
**Measured from the date of publication of the original Danger Zone reports. Dates provided below.
Losing Market Share Rapidly, Tesla Has 64%+ Downside
We first put Tesla in the Danger Zone in August of 2013, and we recently reiterated our opinion on the stock in January 2021. Since then, the stock has outperformed as a short vs. the S&P 500 by 31%. After “record” 2Q21 earnings, it is clear that our original bear thesis is coming true, and TSLA remains highly overvalued.
What’s Working for the Business: Tesla continues to produce and deliver record numbers of vehicles. In 2Q21, the firm delivered just over 201 thousand vehicles, which is up from 91 thousand in 2Q20 and 184 thousand in 1Q21.
Tesla reported positive GAAP net income of $1.1 billion in 2Q21, which included only $354 million in regulatory credits. It is the first quarter Tesla is profitable on a GAAP basis, net of regulatory credits, since 3Q19.
Tesla benefits from increasing demand for electric vehicles, whether by consumer choice or regulatory incentive. However, as demand increases, so does competition, and execution risk, especially given Tesla’s outsized valuation.
What’s the Problem? Tesla’s stock valuation implies it will be the largest auto manufacturer in the world by 2030. So, yes, Tesla is producing more cars, but as more and more competition enters the EV market, we think the window has closed on its first-mover advantage enabling the company to live up to its stock price.
The Competition is Here, It’s Big and It’s Growing. As we first stated back in October 2016, the incumbent automakers bring billions in cash flow profitability along with unmatched scale and manufacturing expertise to the EV market. In contrast, Tesla has burned through $19.5 billion in free cash flow (FCF) over the past five years and $2.3 billion over the TTM to produce a paltry number of cars compared to the incumbents. We don’t think Tesla can pretend to keep up with any of the incumbents, much less all of them. For example:
- Ford (F), with the recent introduction of its Mustang Mach-E and announcement of the F-150 Lightning, is increasing EV investments to $30 billion through 2025. The firm targets 40% of sales will be EVs by 2030, which, based on 2019 (pre-pandemic) sales, implies upwards of 2.2 million EVs sold in 2030, or 9% of the International Energy Agency’s (IEA) base forecast for EV sales in 2030.
- Volkswagen, Europe’s largest automaker will invest over $178 billion through 2025 in battery and software technology and is targeting 50% of its global vehicle sales to be battery powered by 2030. At 2019 (pre-pandemic) sales, that target implies around 5.5 million EVs in 2030, or 21% of IEA’s base forecast for EV sales in 2030.
- General Motors recently announced it is increasing its investment in EVs to $35 billion (up from prior $20 billion) through 2025 and delivering 30 new EVs over the same time. Given this level of investment, GM is targeting EV sales of “more than 1 million” by 2025. Based on the IEA’s base case for 2025 global EV sales, GM’s target would give the firm an 8% share of the EV market.
Combined, Ford, Volkswagen and GM are planning to spend $243 billion through 2025 and produce upwards of 9 million EVs by 2030. These numbers don’t count what other incumbents (Toyota, Volvo, Honda, Jaguar Land Rover, Porsche, Mercedes, BMW, and more) and new entrants (Rivian, NIO, Lucid Motors, Lordstown Motors, and more) will contribute. Clearly, Tesla is faced lots of deep-pocketed competition.
Bears might be unfazed by the competition, but Tesla’s stock price cannot sustain anything close to current levels if Tesla does not become the most profitable car company of all time – by a wide margin.[2]
Current Price Implies Tesla Profits Will be 5x Toyota’s TTM Profits: To justify its current price of $690/share, our reverse discounted cash flow (DCF) model shows that Tesla must:
- improve its NOPAT margin to 7% (compared to 3% TTM), which is equal to General Motors’ TTM NOPAT margin and
- grow revenue at a 41% CAGR for the next 10 years.
In this scenario, Tesla would generate $979 billion in revenue by 2030, and the firm’s NOPAT would equal $70.5 billion (vs. $1.4 billion TTM). For comparison, the combined TTM revenue of Toyota, Honda Motor Co. (HMC), Ford Motor Company, General Motors, and Stellantis (STLA) is $722 billion, and their combined TTM NOPAT is $33.5 billion. Toyota generated TTM NOPAT of $15.1 billion, or just one-fifth of Tesla’s implied NOPAT in this scenario. If you don't think the market expectations for Tesla’s revenue and profits seem too high, then take a look at the market’s expectations for Tesla’s share of the EV market.
Current Price Implies Tesla Owns 93% of Global EV Market: If we assume Tesla can get its average selling price (ASP) to $41k (the average car price in the U.S. in April 2021 vs. current ASP of ~$51k), Tesla’s current stock price implies the firm will sell 24 million vehicles in 2030 (up from ~700k in the TTM period), or 93% of the IEA’s base case for expected global 2030 EV sales. For reference, Toyota and General Motors sold 9 and 7 million vehicles respectively in the 12 months ended March 2021.
In other words, Telsa’s stock price implies its global share of EV sales will improve from roughly 17% in 2020 to 93% in 2030, and the company will sell 2.7x and 3.4x as many cars as Toyota and GM. See Figure 2 for details.
If Tesla’s ASP falls lower, to $25k (equal to Toyota TTM ended March 2021) or $15k (equal to General Motors TTM ended March 2021), the market share implied by its current stock price is greater than 100% of the expected 2030 EV sales.
Now that we know where the stock price is setting the bar for Tesla’s production and market share gains, let’s review some of the challenges to Tesla reversing its current market share losses.
Full self-driving (FSD) is not working – in theory, FSD will drive sales of millions of robotaxis. In reality, the software is fraught with serious safety issues. Rather than being the groundbreaking feature promised for years, it’s nothing more than a gimmick at this point. Even CEO Elon Musk admitted on the 2Q21 earnings call that “we need to make Full Self-Driving work in order for it to be a compelling value proposition.”
Jake Fisher, senior director of Consumer Reports’ Auto Test Center, noted “videos of FSD beta 9 in action don’t show a system that makes driving safer or even less stressful.” Videos of Tesla’s FSD incorrectly identifying road objects (such as the moon for a yellow light) are aplenty. As more automakers roll out more advanced driver assistance platforms (such as GM Cruise), the inadequacies of Tesla’s FSD become more glaring.
Trouble in China Persists – while Tesla is the first foreign carmaker not required to partner with a local Chinese company to build cars in the country, its relationship with China’s government has soured. In March, China banned Tesla vehicles from entering military complexes, based on concerns that the vehicles’ cameras could be used improperly. In June, China’s vehicle safety authority announced that Tesla was implementing a voluntary recall for over 285,000 vehicles. Meanwhile, local Chinese competitors, including Geely, the largest Chinese automaker, are launching their own electric vehicles aimed to take market share from Tesla.
Any investor that doesn’t see mounting risk for Tesla in China has not been paying attention to the recent regulatory actions taken against Didi Global (DIDI), Alibaba (BABA) and Tencent (TCEHY).
Market Share Losses Make Market Expectations Look Silly. Tesla is losing market share, a trend we expect to continue. In April, Credit Suisse estimated Tesla’s global market share fell to its lowest level since January 2019. In the U.S., Automotive News notes that, in May, Tesla sold just two of the top 10 EVs, based on registrations, compared to four of the top five during the same time last year.
While bulls will argue that rising volume is more important than market share, the stock price tells a different story. Bears cannot argue with the math that shows the unrealistically massive increase in both production and market share implied by Tesla’s stock price.
TSLA Has 83%+ Downside With 25% Market Share
If we estimate more reasonable (but still very optimistic) production and market share achievements for Tesla, e.g. selling 6.5 million cars (at an ASP of $41k) and 25% share of the global EV market in 2030, the stock is worth just $148/share. Here’s the math:
- NOPAT margin improves to 7% and
- revenue grows by consensus estimates from 2021-2023 and
- revenue grows 18% a year from 2024-2030, then
the stock is worth just $148/share today – an 83% downside to the current price. See the math behind this reverse DCF scenario. If Tesla fails to achieve 7% margins or grows revenue slower than what we assume, then the downside is even larger.
Figure 2 compares the firm’s historical NOPAT to the NOPAT implied by its current stock price and NOPAT implied by consensus estimates to illustrate just how high the expectations baked into Tesla’s stock price remain. For additional context, we show Toyota’s, General Motors’, and Stellantis’ TTM NOPAT.
Figure 2: Tesla’s Historical and Implied NOPAT: DCF Valuation Scenarios
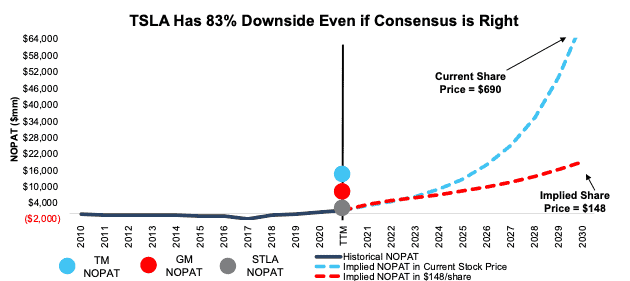
Sources: New Constructs, LLC and company filings
Each of the above scenarios assumes Tesla is able to grow revenue, NOPAT, and FCF without increasing working capital or fixed assets. This assumption is highly unlikely but allows us to create best-case scenarios that demonstrate how high the expectations embedded in the current valuation are. For reference, Tesla’s invested capital has grown 48% compounded annually since 2010 and 9% compounded annually over the past five years.
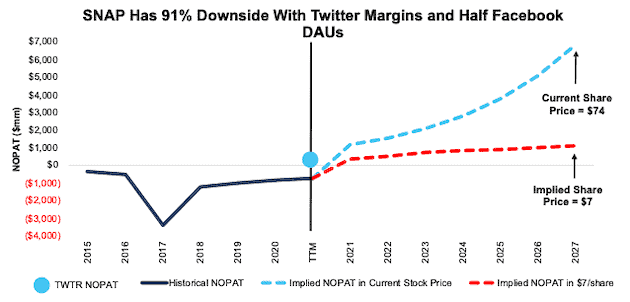
Snap Has 91%+ Downside
We first put Snap in the Danger Zone in August 2018 and closed the position in February 2019. During which time the stock fell 65% (vs. S&P 500 +14%). We put Snap back in the Danger Zone in September 2020 and reiterated our opinion in May 2021. Below, we’ll show we what learned from 2Q21 earnings and why Snap still holds 91%+ downside risk.
What’s Working for the Business: Nearly every investor knows aboutSnap’s “growth-story”. The firm’s revenue grew 116% YoY. Daily active users (DAUs) increased 55 million YoY, or 23%, which represents the highest YoY revenue and daily active user growth in 3+ years.
DAU growth was more robust in the Rest of World (+56%) and Europe (+10%) markets while North American DAUs grew 6% YoY. Average revenue per user(ARPU) was up 75% YoY, driven largely by improvements in the North American and European markets.
Snap has successfully reached its target demographic. In 2Q21, Snap noted it reaches 90% of 13-24 year old’s and 75% of 13-34 year old’s in the United States, United Kingdom, Australia, France, and the Netherlands. Snapchat reaches 70%+ of 13–34-year-olds in countries that comprise over half the world’s digital ad spend.
What’s Not Working for the Business: While reaching 70%+ of 13–34-year-olds is a great achievement, it means Snap is nearing its ceiling on DAUs without coming close to generating profits. There are not many more users Snap can hope to reach before the user growth story implodes.
In the United States, by far the market with the highest average revenue per user (ARPU), DAU growth has decelerated in each of the past five quarters, from 10% YoY in 1Q20 to 6% YoY in 2Q21. Europe tells a similar story, with DAU growth slowing from 15% YoY in 1Q20 to 10% YoY in 2Q21. The Rest of World segment is showing accelerating growth, but ARPU remains just one-seventh that of the United States. In other words, most of Snap’s growth is in the least profitable markets, which makes achieving firm-level profitability more difficult.
For investors that care about fundamentals, Snap’s Core Earnings were -$196 million in 2Q21, even worse than reported GAAP net income of -$152 million. Trailing-twelve-month ROIC remains highly negative at -16%. Free cash flow (FCF), when accounting for the change in net working capital and fixed assets, was -$2 billion in 2Q21, which is worse than -$1.1 billion in FCF in 2Q20. Over the TTM, Snap’s FCF sits at -$2.7 billion.
We do not see how Snap will ever be profitable given the competitive advantages of its primary competitors and its lack of differentiation. New ideas are commoditized in almost real-time across all social platforms.
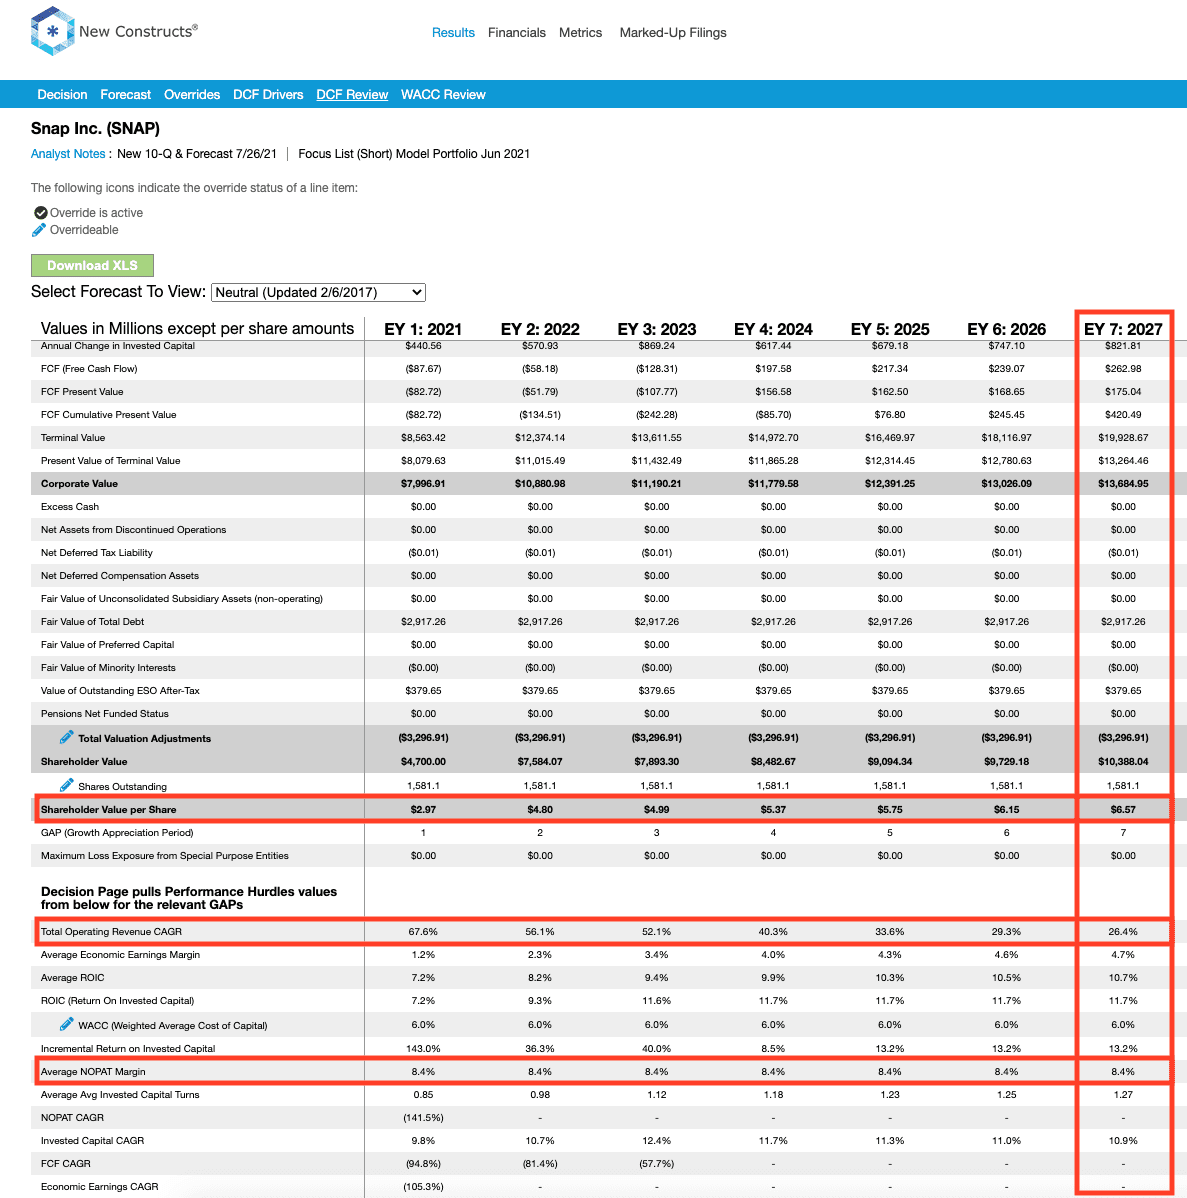
Current Price Implies Snap Rivals Facebook’s Margins and DAUs: To justify its current price of $75/share, Snap must:
- immediately improve NOPAT margin to 34% (which equals Facebook’s TTM NOPAT margin, compared to Snap’s -22% TTM margin) and
- grows revenue at a 34% CAGR through 2027 (more than double projected industry growth).
In this scenario, Snap would generate nearly $20 billion in revenue in 2027, which is nearly 6x its TTM revenue. At its current annual ARPU[3], $12.30 at the end of 2Q21, this scenario implies the firm would have over 1.6 billion DAUs, or just 15% fewer than Facebook’s DAUs at the end of 2Q21. See Figure 3 for comparison of Snap’s implied DAUs to its social media peers.
We think it overly optimistic to assume Snap will achieve margins on par with Facebook, especially while growing DAUs to 1.6 billion. Perhaps, bulls could argue that Snap might be able to raise margins or DAUs to Facebook levels, but we think it is silly to suggest the firm could do both.
Figure 3: Snap’s Implied DAUs vs. Its Competition[4]
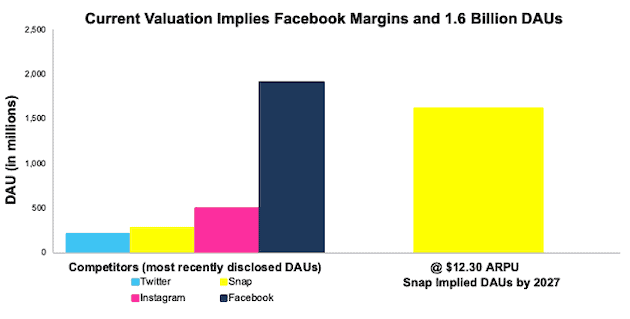
Sources: New Constructs, LLC and company filings
There’s 91%+ Downside if we assume Snap achieves Twitter-like margins and half the DAUs of Facebook. In this scenario, we assume Snap’s:
- NOPAT margin improves to 8% (equal to Twitter’s 3-year average margin) and
- revenue grows at a 26% CAGR through 2027 (1.5x projected industry growth rates), then
the stock is worth just $7/share today – a 91% downside to the current price. At Snap’s current ARPU, this scenario implies Snap has 1 billion DAUs in 2027. Even if we assume Snap can double its ARPU, this scenario implies it has 525 million DAUs, or 179% of its TTM DAUs. If Snap’s growth falters, as it hits the ceiling on DAUs, or fails to improve margins as quickly as estimated in this scenario, the downside risk in the stock is even higher.
Figure 4 compares the firm’s historical NOPAT and implied NOPATs for the two scenarios we presented to illustrate just how high the expectations baked into Snap’s stock price remain.
Figure 4: Snap’s Historical and Implied NOPAT: DCF Valuation Scenarios
Sources: New Constructs, LLC and company filings
Each of the above scenarios assumes Snap’s YoY change in invested capital is 10% of revenue in each year of our DCF model. For context, Snap’s invested capital has grown 34% compounded annually since 2015 and change in invested capital averaged 10% of revenue from 2018-2020 and 57% of revenue over the TTM.
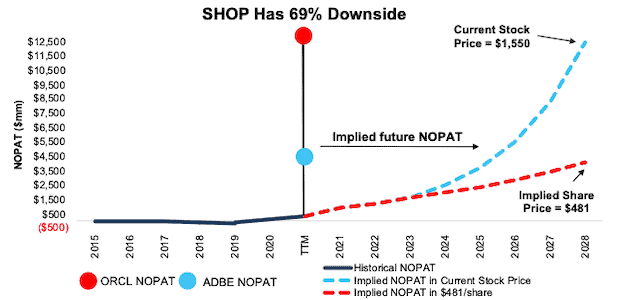
Shopify Has 69%+ Downside
We put Shopify in the Danger Zone in September 2020. Since then, the stock has underperformed as short vs. the S&P 500 by 36%. Despite poor performance as a short, Shopify’s valuation looks more bubble-like than it did when we first put it in the Danger Zone.
What’s Working for the Business: Rising ecommerce sales, spurred in large part by the global COVID-19 shutdowns helped push the firm to its first profitable year in our model. Revenue in 2Q21 was up 57% YoY and gross merchandise volume (GMV) was up 40% YoY.In 2Q21, the firm added additional features to its platform, including analytics and automated marketing to maintain a feature set on par with the ample number of competitors. The firm signed up nearly 700 thousand merchants in 2020, up from ~250 thousand in 2019, which helped drive revenue growth higher.
What’s Not Working for the Business: The success brought on by COVID-19 shutdowns is not sustainable. In its 2Q21 earnings press release, Shopify notes “we do not expect the surge in GMV that drove merchant solutions in 2020 to repeat.” Additionally, the firm notes that consumer spending is beginning to shift back to services and off-line retail, and they expect “e-commerce growing at a more normalized pace relative to 2020.”
The Economist notes ecommerce sales are already beginning to slow, and United Parcel Services’ CEO confirmed as much on CNBC, stating “we realized that when the economy started to open and stores reopened, consumers would go back into their stores and we saw it happen.”
Shopify’s e-commerce and payment processing platform still faces significant competition directly from other platforms such as Adobe Commerce or Squarespace (SQSP), and more traditional sales channels such as Amazon (AMZN) and Walmart (WMT) which operate their own marketplace for third party sellers. With ample competition and minimal differentiation, Shopify has limited pricing power, which is why outside of a pandemic, the firm has been unprofitable.
Next, we explain why investors with fiduciary responsibilities should be cautious about investing in Shopify at anywhere close to the current stock price.
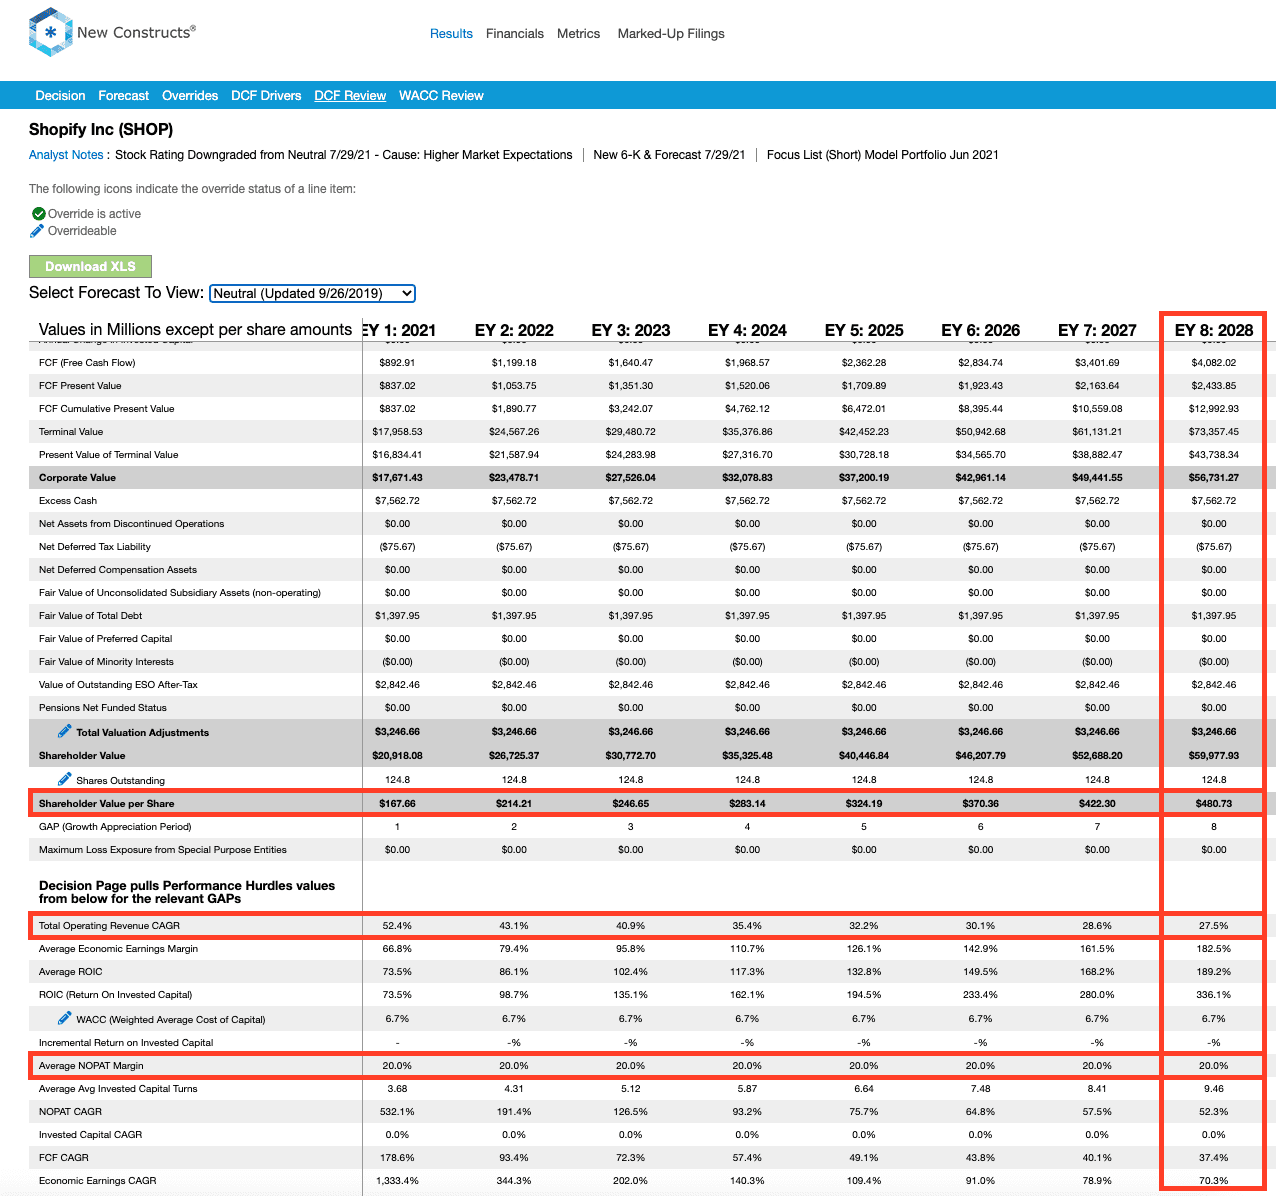
Shopify Priced for GMV to be 5x Bigger than Amazon: To justify its current price of ~$1,550/share, Shopify must:
- improve its NOPAT margin to 20% (compared to 12% TTM), which equals the market-cap weighted average of peers[5], and
- revenue at a 47% CAGR through 2028 (vs. consensus estimates of +52%, +34%, and +37% revenue growth over the next three years.
In this scenario, Shopify would generate nearly $12.5 billion in NOPAT, which translates into $62.3 billion in revenue and 59% of its total addressable market (TAM[6]) in 2028, up from roughly 12% in 2020.
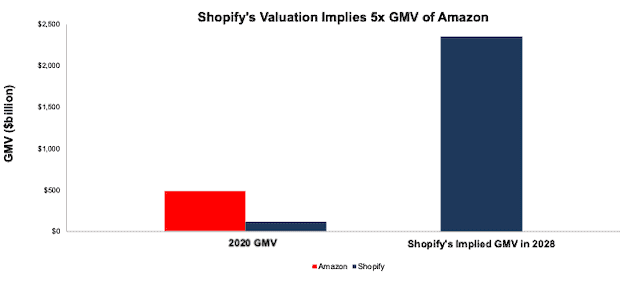
The implied GMV growth required to justify Shopify’s stock price is even more astonishing. In the scenario outlined above, if we assume the same revenue to GMV rate as the first half of 2021[7], Shopify would generate $2.3 trillion in GMV in 2028 – or 31% of Grand View Research’s 2028 global B2C e-commerce market forecast of $7.6 trillion. For reference, Amazon’s GMV in 2020 totaled 13% of the estimated global B2C e-commerce market.
Per Figure 5, Shopify’s current stock price implies its GMV in 2028 will be 20x its 2020 GMV and nearly five times bigger than Amazon’s 2020 GMV.
Figure 5: Shopify’s Implied GMV vs Amazon’s GMV
Sources: New Constructs, LLC and company filings
SHOP Has 69%+ Downside: if we assume:
- Shopify improves its NOPAT margin to 20% and
- revenue grows at consensus rates in 2021, 2022, and 2023 and
- revenue grows 20% a year in 2024-2028 (double e-commerce market CAGR through 2028), then
the stock is worth $481/share today – a 69% downside to the current price. In this scenario, Shopify would earn $4.1 billion in NOPAT, which is 35x its TTM NOPAT and nearly double eBay’s NOPAT.
Figure 6 compares the firm’s historical NOPAT with the implied NOPATs to illustrate just how high the expectations baked into Shopify’s stock price remain. For additional context, we show Oracle’s and Adobe’s (two competitors) TTM NOPAT.
Figure 6: Shopify’s Historical vs. Implied NOPAT
Sources: New Constructs, LLC and company filings.
Each of these scenarios also assumes Shopify is able to grow revenue, NOPAT, and free cash flow (FCF) without increasing working capital or fixed assets. This assumption is unlikely but allows us to create best-case scenarios that demonstrate how high expectations embedded in the current valuation are. For reference, Shopify’s invested capital has grown 63% compounded annually since 2016.
Other Danger Zone Picks That Recently Reported Earnings
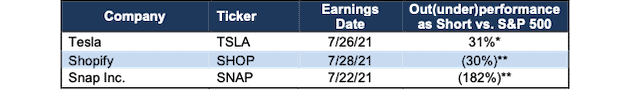
Figure 7 shows other Danger Zone picks that have recently reported their calendar 2Q21 earnings along with their relative performance to the S&P 500.
Figure 7: More Danger Zone Picks That Recently Reported Earnings: Through 7/30/21
| Company | Ticker | Earnings Date | Out (under)performance as Short vs. S&P 500 |
| Netflix | NFLX | 7/20/21 | 3% |
| CoStar Group | CSGP | 7/27/21 | (147%) |
| Spotify | SPOT | 7/28/21 | 32%* |
Sources: New Constructs, LLC
Performance measured from the date of publication of each respective report linked in the table. Performance represents price performance and is not adjusted for dividends.
*Measured from the opening price on the day of Spotify’s direct listing.
Check out this week’s Danger Zone interview with Chuck Jaffe of Money Life.
This article originally published on August 3, 2021.
Disclosure: David Trainer, Kyle Guske II, and Matt Shuler receive no compensation to write about any specific stock, sector, style, or theme.
Follow us on Twitter, Facebook, LinkedIn, and StockTwits for real-time alerts on all our research.
[1] Our research utilizes our Core Earnings, a more reliable measure of profits, proven by professors at Harvard Business School & MIT Sloan.
[2] Toyota, the most profitable publicly-traded automobile manufacturer, generated a company record $22.6 billion NOPAT in fiscal 2018, or less than one-third of the 2030 NOPAT baked into Tesla’s current stock price.
[3] Calculated as TTM revenue of $3.3 billion divided by average quarterly DAUs over the TTM (272 million).
[4] DAUs represent most recently disclosed. Twitter, Snap, Facebook through 2Q21. Instagram last disclosed in 2019.
[5] Peers include Etsy (ETSY), Adobe Systems (ADBE), eBay (EBAY), Oracle Corporation (ORCL), Square (SQ), SAP SE (SAP), GoDaddy (GDDY), salesforce.com (CRM), and Wix.com (WIX).
[6] Estimated TAM of $106 billion based on the projected growth rates of the web content management and payment gateway markets through 2028.
[7] In the first half of 2021, Shopify generated $2.1 billion in revenue from $80 billion in GMV – or $1 of revenue from every $38 of GMV.