
Return on invested capital (ROIC) is not only the most intuitive measure of corporate performance, but it is also the best. It measures the amount of profit generated for every dollar invested by a company, and has clear links to valuation. No wonder the top buy-side investors increasingly want companies to tie executive compensation to ROIC.
Unfortunately, many investors still rely on flawed calculations of ROIC. Most investors use third-party sites for ROIC data, and these sites do not collect the data in the footnotes necessary to reverse accounting distortions. Only by digging through the footnotes and management discussion and analysis (MD&A) can investors get a true picture of the after-tax operating profit (NOPAT) and invested capital of a company.
What Happens When You Get ROIC Wrong
To quantify the importance of footnotes diligence, we developed a metric we call “GAAP-Based ROIC.” GAAP-Based ROIC only uses GAAP (Generally Accepted Accounting Principles) data found in the income statement and balance sheet, so it represents a useful proxy for the various methodologies utilized by other data providers.
Figures 1 and 2 reveal that GAAP-Based ROIC has a significantly weaker link to valuation than our ROIC calculation, which uses our Robo-Analyst technology to make adjustments from rigorous analysis of footnotes and the MD&A. Our ROIC explains 58% of the variation in Enterprise Value/Invested Capital (a cleaner version of price/book) for the S&P 500.
Figure 1: New Constructs ROIC Vs. Enterprise Value/Invested Capital For The S&P 500
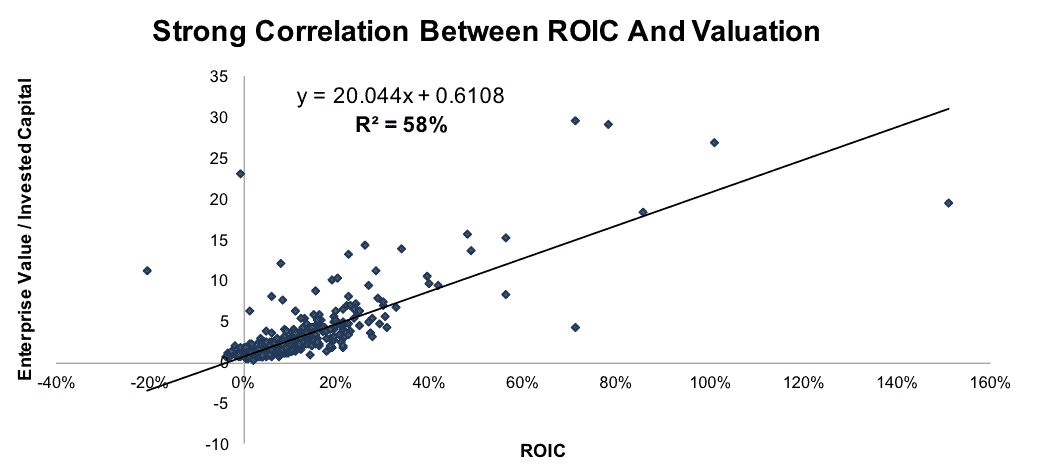
Sources: New Constructs, LLC and company filings.
The GAAP-Based ROIC only explains 40% of the variation.
Figure 2: GAAP-Based ROIC Vs. Enterprise Value/Invested Capital
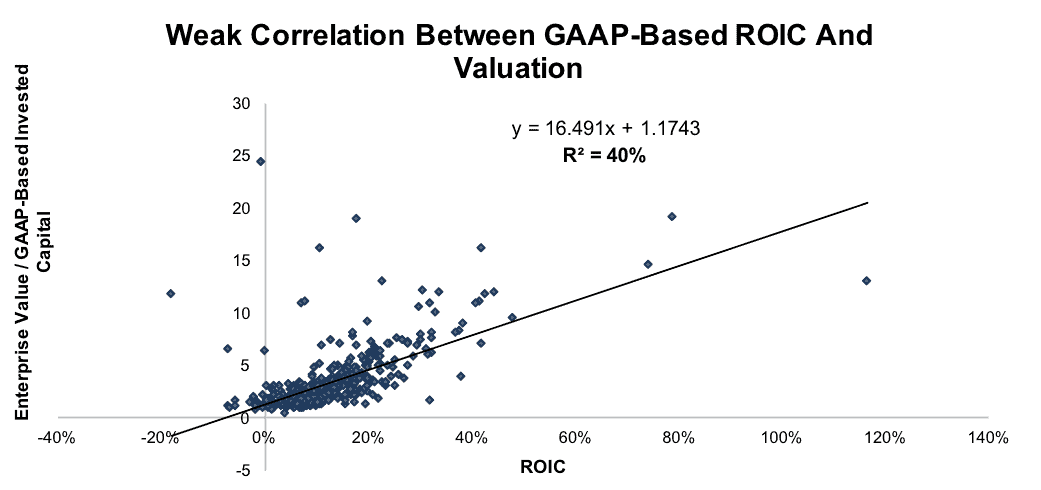
Sources: New Constructs, LLC and company filings.
Investors who use a GAAP-Based ROIC as a tool for evaluating the fundamental quality and valuation of a company are getting a very misleading picture.
Don’t Trust The Company Line
A significant number of companies calculate and report ROIC numbers themselves. Some of these companies do a good job at accurately reporting ROIC. Many do not.
Macy’s (M: $22/share) stands out as the most egregious example of a company offering a misleading ROIC calculation to investors. The department store has emphasized its reported 18.5% ROIC as a sign of the strength of the business.
If this number were accurate, Macy’s would have the best ROIC of any department store we cover, and it would be in the top 20% of the roughly 3,000 stocks under our coverage. Unfortunately for the company and its shareholders, Macy’s ROIC calculation (seen here) contains a number of misleading adjustments.
- Macy’s reports a pre-tax value for operating income, while ROIC is commonly calculated using after-tax operating profit.
- The company removes asset impairments from operating profit but does not add back accumulated impairments to invested capital. This adjustment allows management to have their cake and eat it too; they can erase their bad investments without having to accept any decreases to operating profit.
- It also removes the entirety of its $340 million in rent expense, when really it should only be removing the $130 million of implied interest expense.
- Macy’s nearly $4 billion in goodwill doesn’t appear anywhere in its calculation, so management is not accountable for money spent on overpriced acquisitions.
- Finally, Macy’s chooses to exclude depreciation and amortization expense from operating income while adding back accumulated depreciation and amortization to invested capital. Unlike the company’s treatment of impairments, this adjustment is at least fair to the numerator and denominator. However, it is not the normal practice in this sector (e.g. makes more sense for the energy sector), and this decision inflates Macy’s reported ROIC by roughly one percentage point.
These “adjustments” help make Macy’s reported operating profit nearly three times higher than our NOPAT, while its invested capital is 30% lower. Its true ROIC of 4% puts it in the bottom 20% of all companies we cover and about average for department stores.
The fact that Macy’s links executive compensation in part to this flawed ROIC number helps to explain how its CEO has earned nearly $70 million in compensation over the past five years, roughly 1% of the company’s market cap. This compensation was nearly 60% higher than that earned by the CEO of the similarly sized and much more profitable (ROIC is 7%) Kohl’s (KSS).
The market clearly does not believe in Macy’s self-reported ROIC, as the stock has fallen 67% over the past two years. Focusing on ROIC only works if you use a rigorous and accurate calculation.
This article originally published on June 22, 2017.
Disclosure: David Trainer and Sam McBride receive no compensation to write about any specific stock, sector, style, or theme.
Follow us on Twitter, Facebook, LinkedIn, and StockTwits for real-time alerts on all our research.
Click here to download a PDF of this report.
Photo Credit: lendingmemo.com (Flickr)