
As tireless advocates for the importance of Return on Invested Capital (ROIC), we’ve been encouraged to see a growing appreciation for the metric in the investment community. Most recently, ROIC ranked as the most important metric for investment decisions according to a survey of global investors.
Unfortunately, many investors may be relying on flawed calculations of ROIC. Our research on this topic took us to a remarkable Morningstar (MORN) forum thread from 2011. The thread originated with a user who wanted to know why the company used net income rather than the correct net operating profit after tax (NOPAT) as the numerator in the ROIC calculation. Over the course of several months:
- The Morningstar representative said the company’s own analysts use NOPAT for their internal models.
- No satisfactory explanation was given for why the flawed calculation using net income remained the default for the public-facing website.
- One user wrote, “I would like to kindly remind you that M* is calculating return on invested capital (ROIC) in a way that is financially meaningless.”
- Another user wrote, “M* is not the only service doing the ROIC calculation poorly – I can’t find any other service using appropriate values.”
While the last person must not have discovered New Constructs, it’s true that the most firms offer ROICs with glaring flaws in their methodology or data.
Reliance On Faulty Numbers
The Google search “TICKER ROIC” for almost any ticker shows GuruFocus as the first result. GuruFocus has a much better calculation than many of its competitors as it at least starts with the correct formula of NOPAT/Average Invested Capital.
At the same time, there’s a big difference between claiming to use “NOPAT” and “Invested Capital,” and actually calculating those numbers in an accurate and complete way. In the case of GuruFocus, its website shows that its NOPAT and Invested Capital are based on unscrubbed accounting numbers.
Without digging into the footnotes, it’s impossible to calculate ROIC in way that is meaningful and comparable across companies. Figure 1 shows how GuruFocus tends to overstate ROIC for companies in the S&P 500.
Figure 1: Cap-Weighted Average ROIC For The S&P 500: Guru Focus Vs. New Constructs
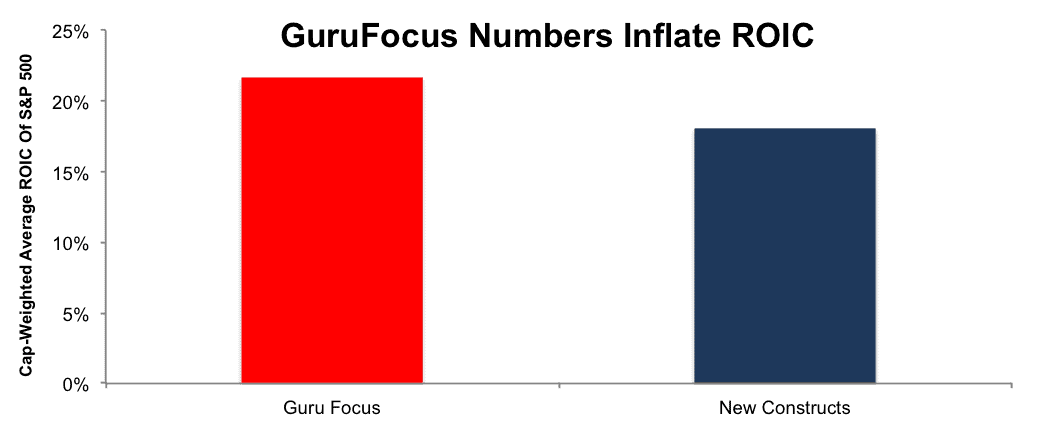
Sources: New Constructs, LLC and company filings.
Most of the differences in ROIC comes from the fact that GuruFocus’ definition of invested capital ignores a number of critical items. There are many loopholes companies can use to hide capital off the balance sheet and inflate ROIC.
Figure 2 shows three (out of a total of 12) of the largest adjustments we make to invested capital:
- Adding back off-balance sheet debt due to operating leases
- Removing accumulated other comprehensive income (OCI)
- Adding back accumulated asset write downs
Combined, these three items account for over 15% of all invested capital for S&P 500 companies.
Figure 2: Balance Sheet Adjustments Matter For Getting Invested Capital Right
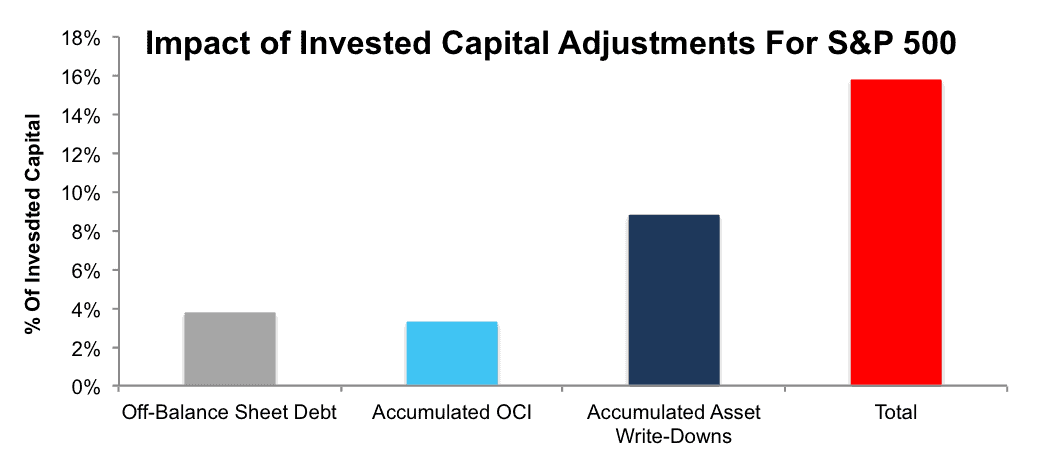
Sources: New Constructs, LLC and company filings.
Faulty Numbers Lead To Faulty Analysis: “Garbage In, Garbage Out”
The TJX Companies (TJX) has one of the largest discrepancies between its ROIC on GuruFocus (63.26%) and our ROIC calculation (18.5%) for any S&P 500 company. This discrepancy comes largely from the three items above.
In particular, GuruFocus’ failure to account for operating leases has a significant impact here. The site’s calculation of invested capital—which includes only reported debt on the balance sheet, minority interest, and shareholder’s equity—is just $3.8 billion. Meanwhile, the company has nearly $6.6 billion in off-balance sheet debt.[1]
Add in $700 million in accumulated OCI and $250 million in accumulated asset write downs, along with a couple other adjustments, and you end up with a true average invested capital of $13.1 billion, over three times the GuruFocus number.
This faulty methodology not only inflates ROIC, it also creates misleading comparisons. According to GuruFocus, TJX competitor Ross Stores (ROST) has a lower ROIC of 51.13%. However, that’s mainly because ROST is less reliant on operating leases and has almost no accumulated write-downs or OCI. When we make these adjustments, we see that ROST is actually slightly more profitable than TJX, with an ROIC of 19.7%.
It’s not just the invested capital side that has issues. GuruFocus’ NOPAT calculation, which is just Operating Income*(1-Tax Rate) also fails to account for a number of important accounting loopholes.
For instance, General Electric (GE) has an annualized NOPAT of $15.7 billion and an ROIC of 14.18% on the site. GuruFocus fails to account for a $3.2 billion decrease in reserves and an abnormal situation that allowed the company to have a tax rate of effectively zero in the most recent quarter. Adjusting for these and other unusual items, GE actually has a NOPAT of $4.2 billion and an ROIC of 2.2%. GuruFocus numbers make it look as if GE is a thriving business while our diligence reveals that it is a struggling company in the midst of a major overhaul. More details on GE’s ROIC can be found here.
Lack of Transparency… If The Work Is Good, Why Not Show Us?
We’re not singling out GuruFocus for criticism. In fact, the site does a far better job of making its calculations clear and transparent than any of the others out there. This transparency makes it easy to contrast its methodology with our own.
By comparison, other sites have almost no transparency with their calculations. Finding the forum post with the Morningstar definition took intensive searching. Ycharts gives a perfunctory and incomplete definition. The Wall Street Journal gives no methodology and has a disclaimer at the bottom that the data is not intended for trading purposes and that the data provider is not liable for any errors.
Lots of sites claim to provide ROIC, but few are willing to show the formulas or data underlying their calculation. We can only guess as to why they are not transparent…but it is probably because they know their methodology doesn’t hold up to rigorous scrutiny.
Calculating ROIC (The Right Way) Is Hard
We documented many of the difficulties involved in calculating ROIC back in January in “If ROIC Is So Great, Then Why Doesn’t Everyone Use It?” There’s been an awareness of the importance of ROIC and a demand for a rigorous calculation ever since the 1990’s.
The technology didn’t exist to perform the ROIC calculation with integrity on a large scale back then. Even today, it’s still extremely difficult. Technologies such as XBRL that were supposed to make the process of parsing filings easier are not yet sophisticated enough to be useful.
GuruFocus, Morningstar, YCharts, The Wall Street Journal: these firms are organized around certain goals, and they do them well. Calculating ROIC is not a priority for any of them, and as such they tend to get it wrong.
On the other hand, New Constructs was built with a singular focus on providing high-integrity calculations of ROIC. Our technology, our people, our whole organization are built to provide investors, consultants and advisors with the highest quality data and the most rigorous calculation of ROIC.
This article originally published here on December 5, 2016.
Disclosure: David Trainer and Sam McBride receive no compensation to write about any specific stock, sector, style, or theme.
Scottrade clients get a Free Gold Membership ($588/yr value) as well as 50% discounts and up to 20 free trades ($140 value) for signing up to Platinum, Pro, or Unlimited memberships. Login or open your Scottrade account & find us under Quotes & Research/Investor Tools.
[1] Note that FASB’s new requirement to bring off balance sheet operating lease debt to the balance sheet in coming years does not fix this problem. This accounting rule change creates comparability issues between years where operating leases are on balance sheet and when they are not. In addition, after companies put operating leases on balance sheet, the myriad of different ways companies can value the operating lease debt will undermine the ability to rely on unadjusted accounting numbers to perform apples-to-apples comparisons. Our models address all of these issues and have done so for over a decade.
7 replies to "Make ROIC Great Again"
Thanks for a nice overview on this…FASB’s attempts to regulate reporting always feels like nailing jelly to the wall but I give them credit for trying. Keep up the good work and thanks for pointing out the potential pitfalls.
Thanks for these insights and examples. David and Sam, please comment on the use of Net Operating Assets as “invested capital”. Based on your data, how would NOPAT/NOA look when comparing companies? What are the pros and cons of this approach?
Best regards,
David
Thank you for a great article. We will look into the calculation again.
We do have limitations as we need to calculate the numbers for more than 50,000 companies worldwide. It is impossible for us to get into the details that are company specific.
regards!
Charlie Tian, Ph.D.
Founder, http://www.gurufocus.com/
What formula do you guys use to calculate invested capital?
You can see our formula for Invested Capital here
Interesting article on a critical topic. In the second paragraph you define NOPAT as “non-operating…” when I think you are referring to “net operating…”. Can you confirm?
Also wondering if you could answer the question posed by David Phillips in his December 19, 2016 comment as I have also wondered about this.
Thanks for your good work!
Correct, thanks for pointing out that typo, I’ve corrected it. As for the question about using Net Operating Assets as Invested Capital, that approach still has certain limitations because it only accounts for the balance sheet. Assets and liabilities that are held off the balance sheet (operating leases, write-downs, reserves, deferred compensation, etc.) don’t show up in Net Operating Assets.
Beyond this primary flaw, there a couple of other minor methodological issues with NOA. It treats all cash as non-operating, when in reality most companies require a certain amount of cash to run their operations on a day-to-day basis. Also, it doesn’t account for the distortion of midyear acquisitions.
Overall, NOA is a good starting point for calculating Invested Capital, but there are still a number of adjustments you need to make to get to an accurate number.