We closed this Danger Zone pick on May 14, 2025. A copy of the associated Position Close report is here.
Expected to begin trading February 11, 2021, Bumble Inc. (BMBL: $38/share midpoint of IPO price range) has already increased the expected IPO price range to a midpoint of $38/share, which would value the firm at over $7 billion. With a higher valuation, likely due to rising demand for shares, will investors find a perfect match with Bumble?
At that price, the stock will earn our Neutral rating. Unlike other recent IPOs, Bumble achieved profitability in 2019 and has a plausible path to justify the expectations baked into the stock price if the firm’s management can:
- Continue taking market share as it has since 2017
- Continue increasing its average revenue per paying user (ARPPU)
- Leverage its network to grow efficiently.
This report aims to help investors sort through Bumble’s financial filings to understand the fundamentals, using more reliable fundamental data, and valuation of this upcoming IPO.
Revenue Growth Without Consistent Profits
By empowering women in the dating/matchmaking industry, Bumble found success and built a fast-growing business, albeit with inconsistent profits. Bumble grew revenue from $360 million in 2018 to $489 million in 2019. After reorganizing the firm to what will IPO, revenue growth through 3Q20 slowed to just 15% YoY.
Meanwhile, Core Earnings[1] improved from -$14 million in 2018 to $69 million in 2019. If we assume Core Earnings declined at the same rate as the firm’s operating income, Core Earnings would fall to -$63 million over the first nine months of 2020.
The firm’s Core Earnings margin improved from -4% in 2018 to 14% in 2019 while its return on invested capital (ROIC) improved from -39% to 180% over the same time.
Figure 1: Bumble’s Revenue & Core Earnings: 2018-2019
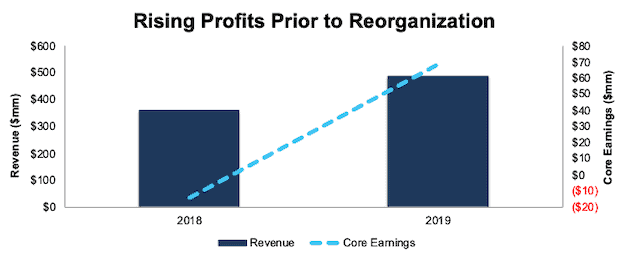
Sources: New Constructs, LLC and company filings
Growing Market Share in the U.S Dating Industry
While Match Group (MTCH) is the clear industry heavyweight (owning six of the top 10 dating apps by revenue in 2020), the Bumble app has significantly improved its market share of the U.S. dating app market in recent years.
Per Figure 2, the Bumble app’s market share increased from 10% in 2017 to 19% in 2020, according to Sensor Tower, an app intelligence and insights provider. Bumble app gains have come at the expense of Tinder, Match, and Other apps.
Figure 2: Bumble App’s U.S. Market Share: 2017 vs. 2020
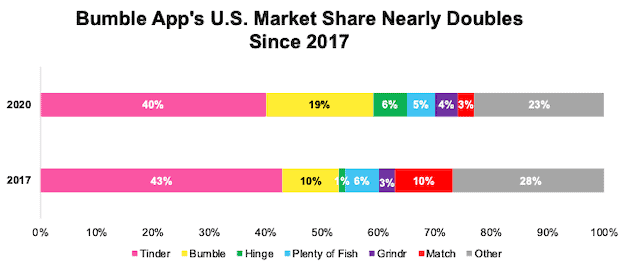
Sources: New Constructs, LLC and Sensor Tower
Bumble’s User Base Is Middle of the Pack…
Despite gaining market share in the U.S., Bumble’s paying users still lag Match’s paying users. Based on the most recent figures for each firm, Bumble has 2.4 million paying users across its apps (Bumble and Badoo) compared to Match’s 10.9 million and Spark Networks’ 1.0 million paying users. See Figure 3. Dating apps, in particular, can benefit from network effects, and Bumble’s ability to grow its user base moving forward will be key to achieving consistent profitability.
Figure 3: Bumble’s Paying User Base Vs. Peers

Sources: New Constructs, LLC and company filings
… but It’s Revenue Per Paying User Is Rising
Bumble has increased its average revenue per paying user (ARPPU) from $15 in 2019 to $18 through September 2020. The Bumble app, the firm’s more well-known, yet smaller app, is more profitable than the larger and slower growing Badoo app, per Figure 4. Due to differences in how each firm calculates users, ARPPU is not directly comparable between Bumble and Match.
Improving ARPPU while cutting costs – Bumble’s total operating costs fell from 105% of revenue in 2018 to 81% of revenue in 2019 – is key to achieving consistent profitability.
Figure 4: Bumble’s Average Revenue Per Paying User: 2018 Through September 2020

Sources: New Constructs, LLC and company filings
Fast Growing Industry Provides Tailwinds as Well
In its S-1, Bumble notes its global addressable market of 804 million singles is expected to grow to 981 million by 2025. For a firm with just 2.4 million paid users, the opportunity to grow users is large.
In terms of dollar growth, the global dating app market (excluding China) is projected to experience significant growth moving forward. According to OC&C Strategy Consultants (OC&C), referenced for industry projections in Bumble’s S-1, the freemium segment of the global online dating market is projected to grow 18% compounded annually through 2025 to a value of $7.7 billion.
Switching Costs Present Challenges – but Aren’t an Existential Threat
The dating industry is highly competitive and switching costs are low, a fact echoed in Bumble’s S-1 and proven by the numerous, similar dating apps available for download. Low switching costs can make attracting and retaining users more expensive and pose a challenge to the firm’s ability to achieve consistent profitability.
However, Bumble aims to differentiate itself by letting women make the first connection, which has resulted in a different user base. According to OC&C, the Bumble app has ~30% more female users for every male user compared to the gender mix of users who do not use the Bumble app. Additionally, OC&C finds that a higher percentage of Bumble app’s female users convert to paying users than the market average. Such differentiation has also helped Bumble attract users more efficiently. For the nine months ended September 2020, only 22% of new users were attributed to performance marketing spending.
Beyond direct differentiation, the dating app market may be less winner-take-all than other markets with low switching costs such as food delivery, given the unique nature of the relationship built in the app. For instance, with an app like DoorDash (DASH), consumers are less likely to care whether the food is delivered by DoorDash, Uber (UBER), or any other competitor, so long as it arrives on time.
With a dating app, consumers are likely to care about security, safety, and quality of matches given the intimate information being shared. Case in point, while Uber and DoorDash remain largely unprofitable, Match Group has generated positive NOPAT margin in each of the past 10 years, despite recognizing that active daters use around four apps at a time. Bumble must prove it can achieve similar success if it has any chance of justifying the expectations baked into its stock price, as we’ll show below.
Bumble Is Priced to be the Next Match Group
When we use our reverse discounted cash flow (DCF) model to analyze the future cash flow expectations baked into BMBL, we find that after raising its IPO price range shares are fully valued and priced for near perfect execution.
Scenario 1 – The Next Match Group: Match Group has built a highly profitable business through its multiple apps that make it the largest online dating firm. Investors in Bumble are betting on the firm having similar success and an equally as profitable business.
In order to justify the midpoint of its IPO price range ($38/share), Bumble must:
- achieve a 13% NOPAT margin (equal to Match Group’s 2019 NOPAT margin, compared to an estimated -20% through the first nine months of 2020 for Bumble) and
- grow revenue by 26% compounded annually (above industry growth estimates through 2025 but below Bumble’s 2019 YoY growth rate) for the next eight years. See the math behind this reverse DCF scenario.
In this scenario, Bumble would earn $3.2 billion in revenue by 2027, or 67% of Match Group’s 2019 revenue. This scenario implies Bumble achieves an estimated 26% of the global freemium online dating market in 2025 compared to its 2020 global share of ~17%. For reference, Match.com holds an estimated 72% share of the global freemium online dating market based on 2020 revenue. Spark Networks (LOV) holds an estimated 7% share based on TTM revenue.
Figure 5 compares the firm’s implied future revenue in this scenario to its historical revenue, along with the projected revenue of the global freemium online dating market (only available through 2025).
Figure 5: $38/share Implies Global Market Share Rises from ~17% in 2020 to 26% in 2025
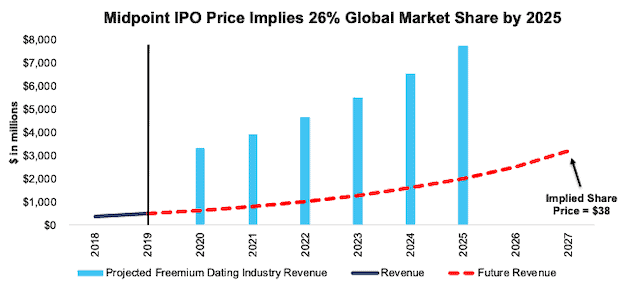
Sources: New Constructs, LLC, company filings, and OC&C industry estimates per Bumble’s S-1
But What If Bumble Is not the Next Match Group?
We review an additional DCF scenario to highlight the downside risk should Bumble not maintain its market share in the face of competition and see profitability fall to levels similar to much smaller competitor Spark Networks.
If we assume Bumble’s:
- long-term NOPAT margin maxes out at 3% (highest in Spark Networks’ history, compared to Bumble’s 18% in 2019 and estimated -20% through the first nine months of 2020) and
- revenue grows by 18% compounded annually for the next decade, then
BMBL is worth just $4/share today – an 89% downside to the midpoint of the IPO price range. See the math behind this reverse DCF scenario.
Each of the above scenarios also assumes Bumble’s working capital and fixed assets increase YoY at a rate equal to 4% of revenue. This growth in invested capital equals the YoY change in invested capital as a percent of revenue in 2019.
IPO Is Not Without Warning Flags
Despite a more reasonable valuation relative to recent IPOs (with share prices that implied >100% of market share), investors should be aware that Bumble’s S-1 is not absent some notable red flags.
Public Shareholders Have No Rights
A risk of investing in Bumble’s IPO, and many recent IPOs, is the fact that that the shares sold provide little to no say over corporate governance.
Bumble is going public with two separate share classes, each with different voting rights. Bumble’s IPO is for Class A shares, with one vote per share. Class B shares don’t have a straightforward number of votes per share. Instead, the number of votes is determined based on the number of Common Units held prior to IPO, but the result is the same as other dual-class share provisions in that class B shares hold majority of the voting power.
Owners of Class B shares will hold 96-97% (depending upon the underwriters’ decision to exercise their options to purchase shares at IPO) of the voting power in the firm. The firm’s founder will own ~15% of the voting power and Blackstone Group (BX), which acquired a majority stake in Bumble in late 2019, will hold ~81% of the voting power in Bumble after its IPO.
Ultimately, this dual-class structure takes investors’ money while giving them almost no voting power or control of corporate governance.
We Don’t Know If We Can Trust the Financials
Investors should take Bumble’s GAAP numbers with a grain of salt because the firm’s management identified a material weakness in internal controls over financial reporting. Specifically, the firm identified a deficiency related to a “lack of defined process and controls over information technology.”
As an emerging growth company, Bumble is not required to have an independent auditor provide an opinion on internal controls, so we’re glad the firm chose to disclose this information. However, the firm notes that it “cannot assure the measures we are taking to remediate the material weakness will be sufficient or that they will prevent future materials weaknesses.” Ultimately, weaknesses in internal controls increase the risk that the firm’s financials are fraudulent and/or misleading.
Misleading Non-GAAP Metrics
Not surprisingly, Bumble’s chosen non-GAAP metric, adjusted EBITDA, shows a much rosier picture of the firm’s operations than GAAP net income. Adjusted EBITDA is every unprofitable company’s favorite metric because it allows management significant leeway in excluding costs in its calculation. For example, Bumble’s adjusted EBITDA calculation removes stock-based compensation expense, litigation costs, and costs affiliated with the IPO process.
Bumble’s adjusted EBITDA through the first nine months of 2020 removes $225 million (54% of revenue over the same period) in expenses including $92 million in transaction costs and fees related to the acquisition by Blackstone Group and over $13 million in stock-based compensation expense.
After removing these items, Bumble reports adjusted EBITDA of $108 million through the nine months ended September 2020 compared to a -$117 million GAAP loss over the same time.
Critical Details Found in Financial Filings by Our Robo-Analyst Technology
Fact: we provide superior fundamental data and earnings models – unrivaled in the world.
Proof: Core Earnings: New Data and Evidence, forthcoming in The Journal of Financial Economics.
Below are specifics on the adjustments we make based on Robo-Analyst findings in Bumble’s S-1:
Income Statement: we made $25 million of adjustments, with a net effect of removing $23 million in non-operating expenses (5% of revenue). You can see all the adjustments made to Bumble’s income statement here.
Balance Sheet: we made $57 million of adjustments to calculate invested capital with a net decrease of $45 million. One of the most notable adjustments was $7 million in deferred tax assets. This adjustment represented 8% of reported net assets. You can see all the adjustments made to Bumble’s balance sheet here.
Valuation: we made $104 million of adjustments with a net effect of decreasing shareholder value by $38 million. The largest adjustment to shareholder value was $48 million in outstanding employee stock options. This adjustment represents 1% of Bumble’s estimated market cap. See all adjustments to Bumble Inc’s valuation here.
This article originally published on February 10, 2021.
Disclosure: David Trainer, Kyle Guske II, and Matt Shuler receive no compensation to write about any specific stock, style, or theme.
Follow us on Twitter, Facebook, LinkedIn, and StockTwits for real-time alerts on all our research.
[1] Only Core Earnings enable investors to overcome the inaccuracies, omissions and biases in legacy fundamental data and research, as proven in Core Earnings: New Data & Evidence, a forthcoming paper in The Journal of Financial Economics by professors at Harvard Business School (HBS) & MIT Sloan.